







- Laser Ultrasonic Testing of Baseline and Fiber-Misaligned 3D-Printed Composite Pusher Caps
King Sum Ma*, Kyu-Jin Lee*, Jung-Ryul Lee*†
*Department of Aerospace Engineering, KAIST
This article is an open access article distributed under the terms of the Creative Commons Attribution Non-Commercial License (http://creativecommons.org/licenses/by-nc/4.0) which permits unrestricted non-commercial use, distribution, and reproduction in any medium, provided the original work is properly cited.
Three-dimensional (3D) printed continuous fiber composites are increasingly considered for unmanned aerial vehicle (UAV) secondary structures because of their geometric flexibility and manufacturing efficiency. However, process-induced features such as inter-bead gaps and disbonding between the Onyx wall/infill and continuous carbon fiber (CF) reinforcement can occur during printing. This paper presents a comparative laser ultrasonic testing (LUT) case study of baseline and fiber-misaligned 3D-printed composite UAV propeller pusher caps. Inspection paths were generated using a previously developed computer-aided design (CAD) model-based scan path generation method and implemented in a robotic pulse-echo ultrasonic propagation imaging (PUPI) system for LUT. Two pusher caps fabricated from the same geometry, material system, and nominal fiber pattern were inspected using identical scan paths and inspection parameters. Variable time window amplitude mapping (VTWAM) and averaged 1D ultrasonic signals of the two specimens were interpreted with respect to the printing path, fiber loop arrangement, and expected void and disbonding locations. The nominally printed baseline specimen showed responses associated with inherent printing features, whereas the fiber-misaligned specimen showed additional localized VTWAM and waveform variations consistent with the expected shallow Onyx wall/CF and medium-depth CF/Onyx infill disbonding conditions. Signal-to-noise ratio (SNR) analysis indicated that sufficient measurement quality was maintained over the curved inspection surface. A correlation-based waveform dissimilarity analysis further quantified the matched-location waveform differences between the two specimens. These results demonstrate the importance of combining robotic PUPI results with CAD geometry and slicer-defined fiber arrangement for interpreting manufacturing process related ultrasonic responses in complex continuous fiber 3D-printed structures.
Keywords: Non-destructive testing (NDT), 3D-printed composites, Laser ultrasonic testing (LUT), Robotics
Recent unmanned aerial vehicle (UAV) secondary structures often utilize three-dimensional (3D)-printed composites because of their geometric flexibility and manufacturing efficiency [1]. However, internal process-induced defects may develop during printing, and void related material quality can affect real world applications of 3D-printed carbon fiber-reinforced composite structures [2,3]. Therefore, post-manufacturing non-destructive testing (NDT) methods capable of evaluating internal process-induced features are needed to support structural integrity assessment. Previous robotic pulse-echo ultrasonic propagation imaging (PUPI) studies demonstrated the feasibility of laser ultrasonic testing (LUT) and computer-aided design (CAD) model-based scan path generation for 3D-printed composites [4,5]. For complex continuous fiber parts such as a UAV propeller pusher caps, ultrasonic response cannot be interpreted solely from the inspection results because even nominally printed structures may contain features caused by slicer-defined tool paths and local bead placement. Accordingly, a nominally printed baseline pusher cap was used as a process-informed comparator for interpreting the fiber-misaligned specimen.
Micro-computed tomography (micro-CT) provides high resolution volumetric characterization of manufacturing defects but is limited by the size of the specimen that can be accommodated. The pusher caps could not be accommodated by the available micro-CT equipment and were not destructively sectioned. Cho et al. [6] compared LUT and micro-CT on smaller 3D-printed carbon fiber-reinforced plastic (CFRP) specimens and reported that LUT visualized defects of similar size, location, and shape, proposing LUT as a practical alternative for inspecting larger structures. Robotic PUPI has also been applied to complex-shaped 3D-printed composite surfaces [4]. Therefore, robotic PUPI was selected in this study to inspect the pusher caps using the CAD model-based scan path generation approach [5]. The measured LUT responses were interpreted with respect to the expected void and disbonding locations rather than treated as verified defect locations.
Previous studies evaluated manufacturing defects in cylindrical continuous fiber 3D-printed structures using LUT [2], established robotic path planning and inspection for complex 3D-printed composite surfaces [4], and introduced CAD model-based scan path generation [5]. Based on these established methods, this study presents a process-informed paired case comparison of a baseline pusher cap and a fiber-misaligned pusher cap fabricated from the same CAD model, material system, and nominal toolpath. The expected void locations were inferred from the slicer-defined nominal Onyx/CF bead arrangement and the imposed fiber nozzle misalignment. The resulting variable time window amplitude mapping (VTWAM) responses and averaged 1D signals were compared at matched nominal CAD positions using a correlation-based waveform dissimilarity index. The objective of this case study is to examine how manufacturing process information can support interpretation of robotic PUPI responses in a complex continuous fiber reinforced 3D-printed component.
2.1 3D-printed composite pusher caps
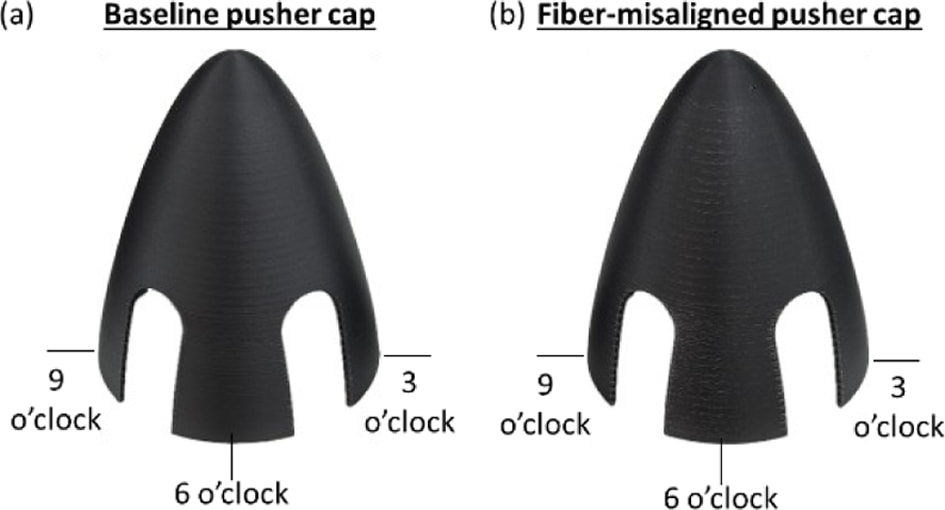
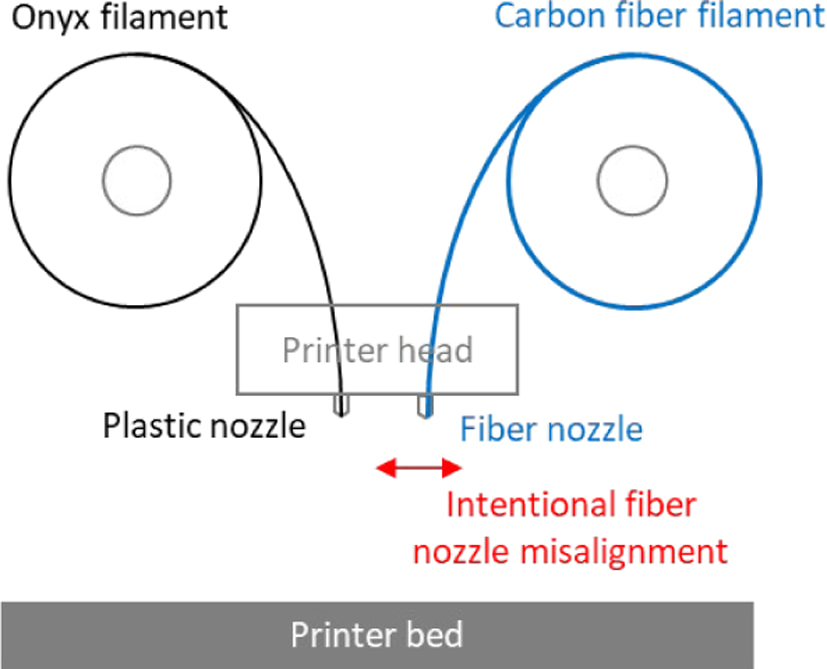
A Markforged X7 material-extrusion 3D printer capable of fabricating continuous-fiber composites was used to fabricate the baseline and fiber-misaligned pusher caps (Fig. 1). The printer head has a plastic nozzle and a fiber nozzle, which extrude Onyx filament (chopped fibers mixed in nylon material) and carbon fiber (CF) filament (multiple strands of CF coated in nylon matrix), respectively (Fig. 2). The nominal filament extrusion thickness was 0.4 mm for Onyx and 1.0 mm for continuous CF.
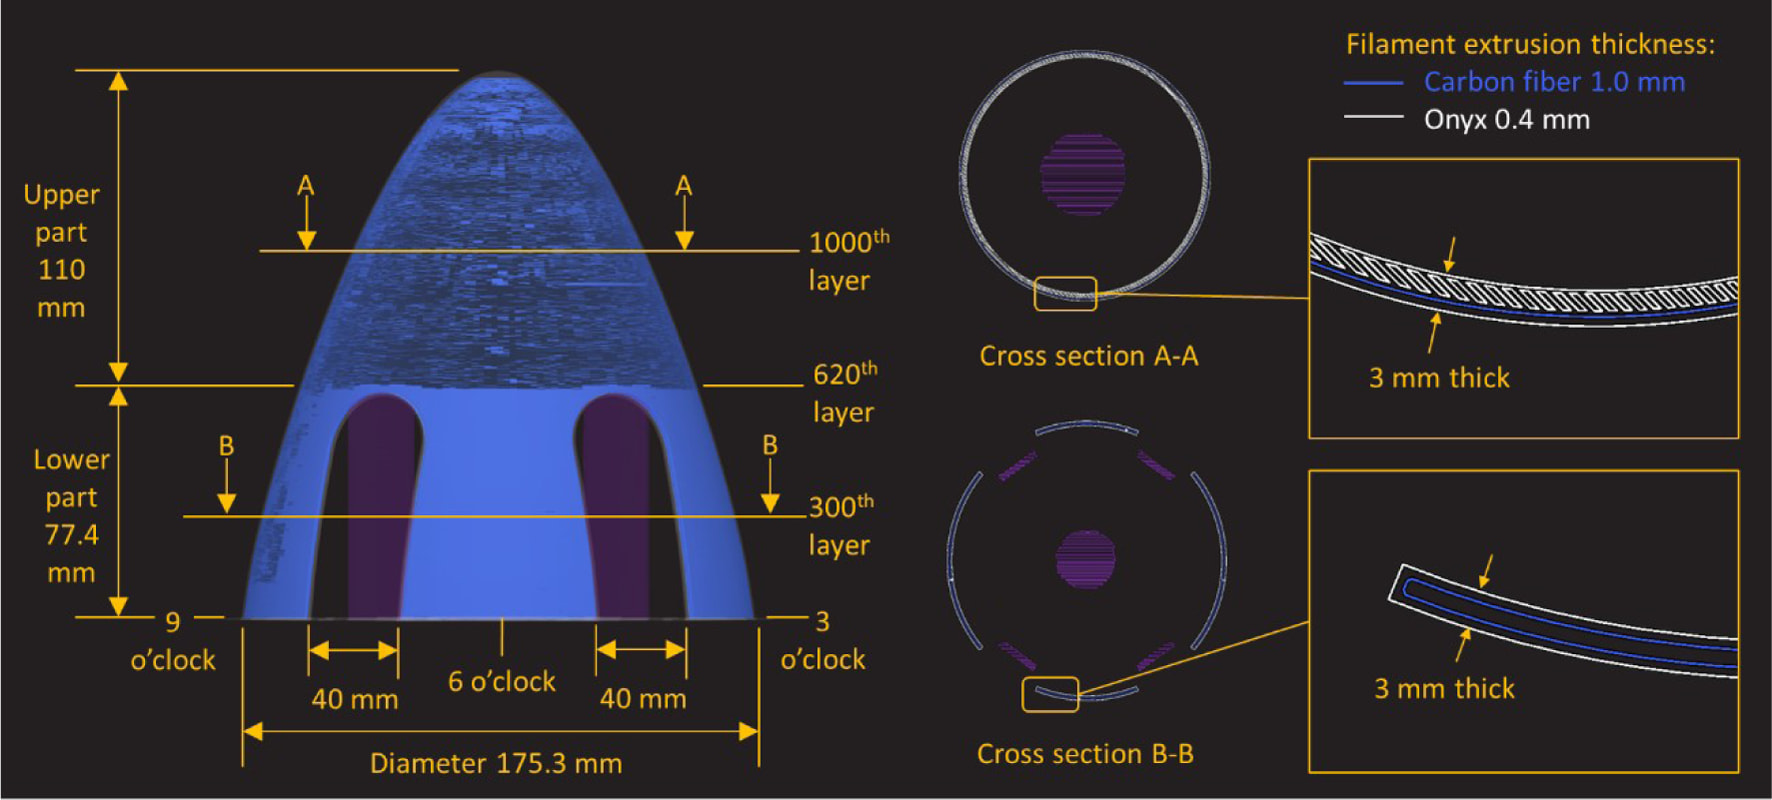
Both pusher caps were manufactured from the same paraboloid-shaped CAD model with an external diameter 175.3 mm, height 187.4 mm, and constant wall thickness 3 mm. Each pusher cap has four 40 mm wide half height openings to accommodate the propeller blades. Fig. 3 shows the 3D-printing toolpaths of continuous CF and Onyx infill settings in slicing software. Identical materials and infill pattern were applied in layers 5-1479 where fiber reinforcement was set for the outer shell, while the layers at floor and roof are pure Onyx. Because of the openings in the design, there were two types of patterns in the pusher caps distinguished as the upper and lower parts. The upper part without openings in the wall had one single concentric fiber loop laid in each layer to reinforce the outer shell. The space between the fiber loop and the inner shell was filled by Onyx. In the lower part, the existence of openings prohibited the fiber to go around the circumference like the upper part. The wall was separated into 4 parts, each containing an individual fiber loop to reinforce the outer shell, giving 4 individual fiber loops in each layer. Almost no Onyx infill was present in the lower part because the 3 mm wall thickness can only accommodate the Onyx outer wall and a fiber loop.
In this study, the baseline pusher cap denotes the nominally printed specimen fabricated without intentional fiber nozzle misalignment. It is used as a nominal manufacturing comparator for matched-location comparison and not as a defect-free control or statistical reference population. The fiber-misaligned pusher cap was fabricated by intentionally misaligning the fiber nozzle relative to the slicer-defined nominal fiber path, with the aim of introducing interfacial gaps between the continuous CF bead and adjacent Onyx beads. Therefore, the Onyx beads followed their nominal deposition paths, whereas the continuous CF beads were deposited at intentionally misaligned positions. Consequently, voids and associated disbonding were expected at the interfaces between the continuous CF and the Onyx outer wall or infill.
2.2 Expected internal conditions
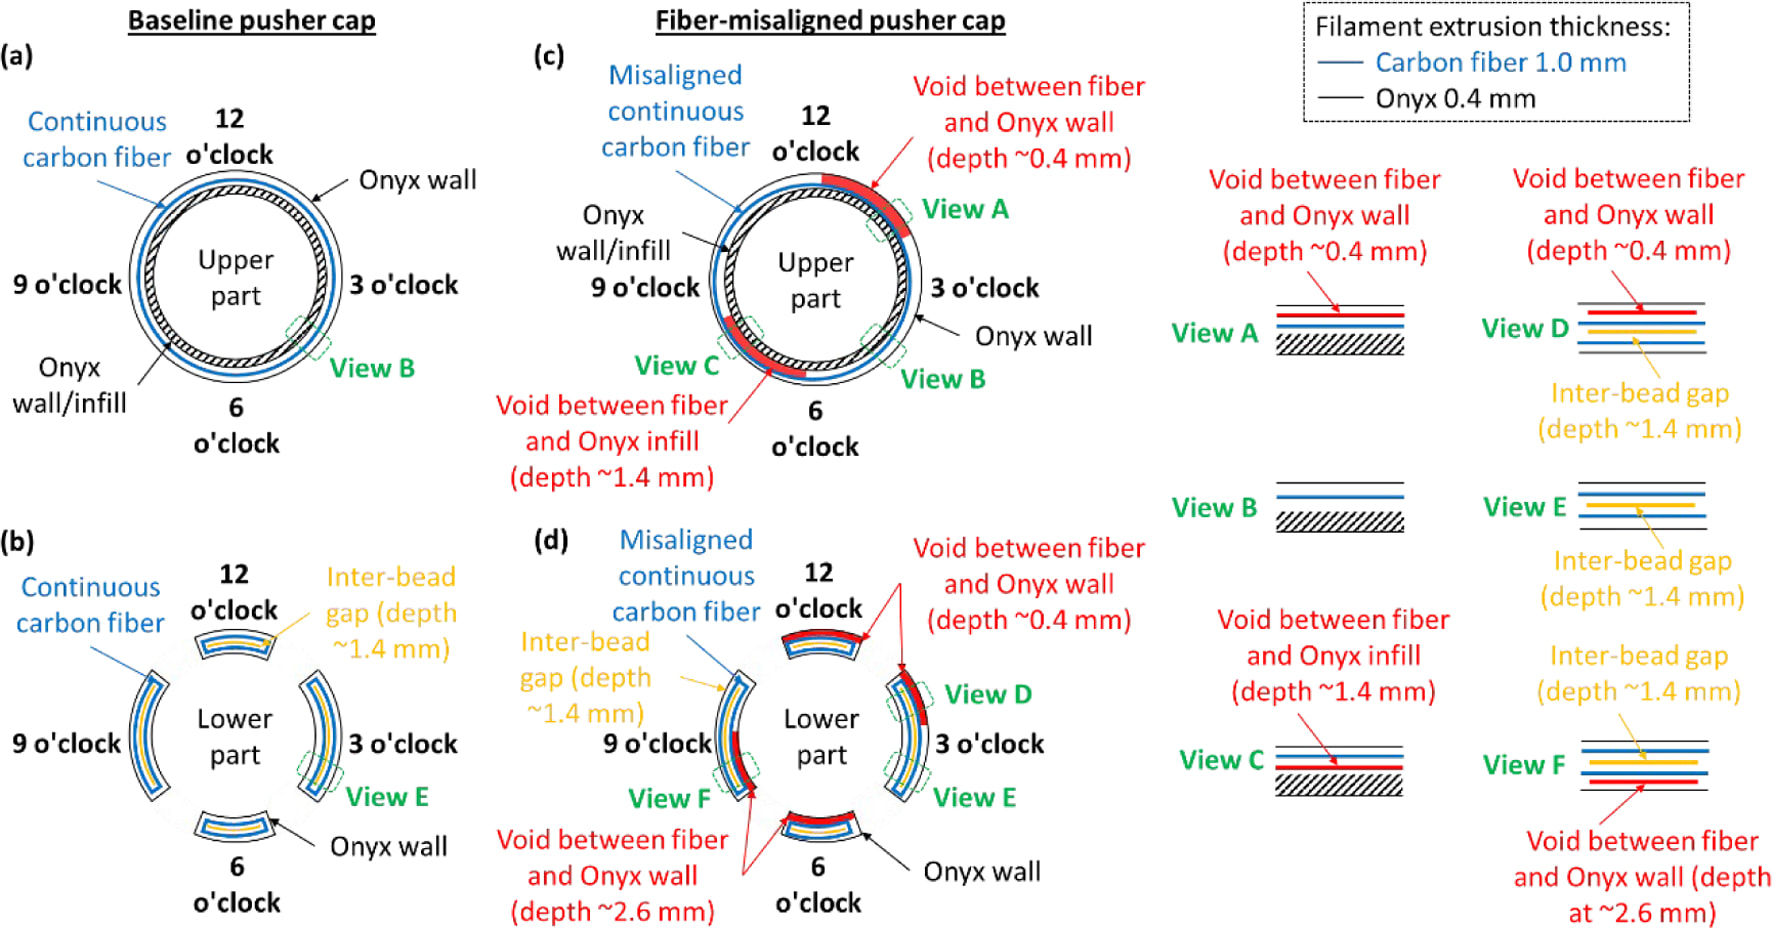
Process-induced voids or inter-bead gaps can occur in both the baseline and fiber-misaligned pusher caps because of the printing mechanism [6]. Fig. 4 summarizes the expected internal conditions based on the slicer-defined nominal Onyx/CF bead arrangement, nominal bead thicknesses, and imposed fiber nozzle misalignment, including the estimated depths from the external surface.
The baseline pusher cap was 3D-printed according to the slicer-defined nominal toolpaths and bead arrangement shown in Fig. 3. The upper part was expected to be unaffected by voids associated with fiber nozzle misalignment (View B). The fibers were expected to remain adjacent to the Onyx wall, with Onyx infill occupying the remaining space. However, inherent inter-bead gaps were expected in the lower part (View E), even though no intentional fiber nozzle misalignment was introduced. These gaps were expected to extend longitudinally in the printing direction because adjacent beads did not fully overlap [6] and to occur approximately in the middle of the wall thickness.
In the upper part of the fiber-misaligned pusher cap, the fiber loops were shifted toward the 6-8 o’clock direction. Voids were expected in the 12-2 o’clock region (View A) between Onyx outer wall and CF, at approximately 0.4 mm depth. In the 6-8 o’clock region (View C), voids were expected to occur between CF and Onyx infill, at approximately 1.4 mm depth. In the lower part, voids were expected to occur between Onyx outer wall and fiber at 12-2 o’clock region (View D), similar to its upper half at approximately 0.4 mm depth. In the 6-8 o’clock region, the voids were expected to occur at approximately 2.6 mm depth between CF and the opposite Onyx wall (View F). However, the shallower inter-bead gap at approximately 1.4 mm was expected to have a greater influence on the measured ultrasound response than the deeper interface at approximately 2.6 mm. Thus, the response in this region was interpreted primarily with reference to the shallower 1.4 mm inter-bead gap rather than used to identify the 2.6 mm interface independently. In the other regions, the inter-bead gaps at 1.4 mm depth were expected.
These expected internal conditions were inferred from the slicer-defined nominal Onyx/CF bead arrangement, nominal bead thicknesses, and imposed fiber nozzle misalignment. They were subsequently used as an interpretation framework for the VTWAM images and averaged 1D ultrasonic signals in Sections 3.1 and 3.3.
2.3 Robotic PUPI system and CAD model-based scan path generation
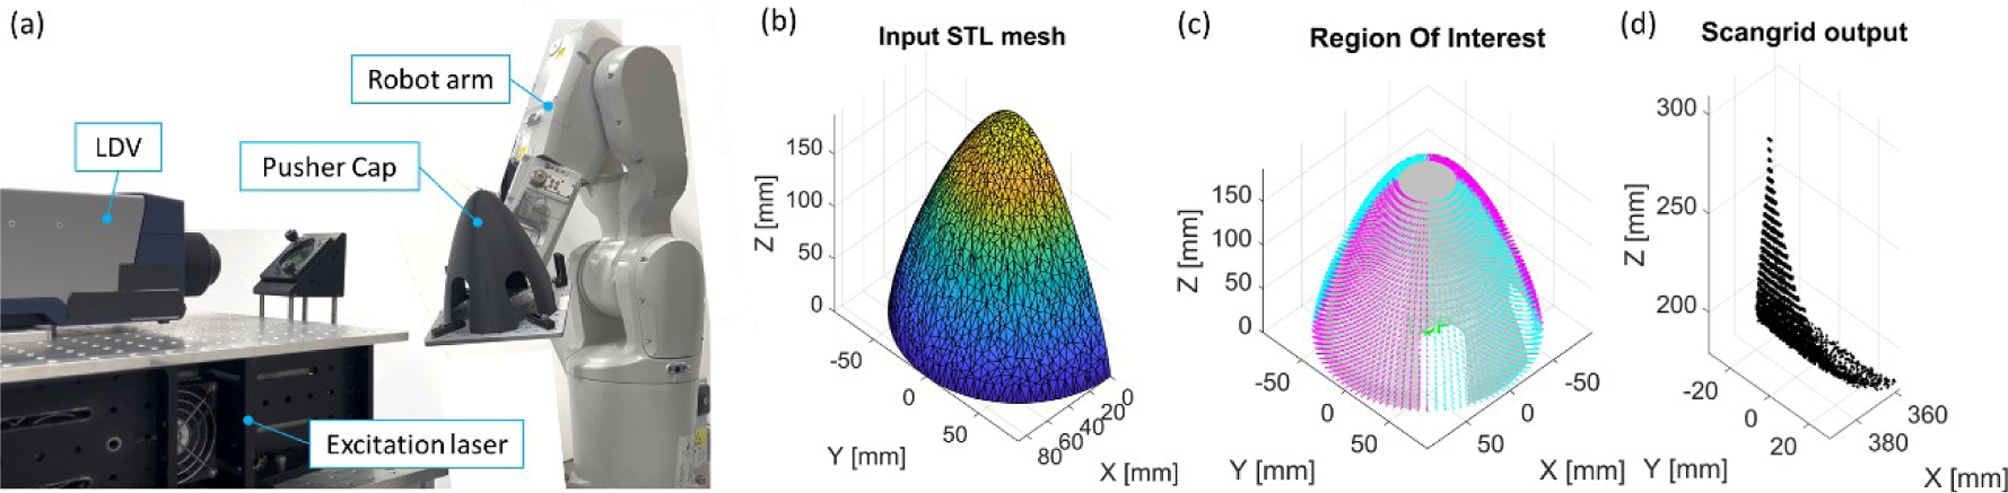
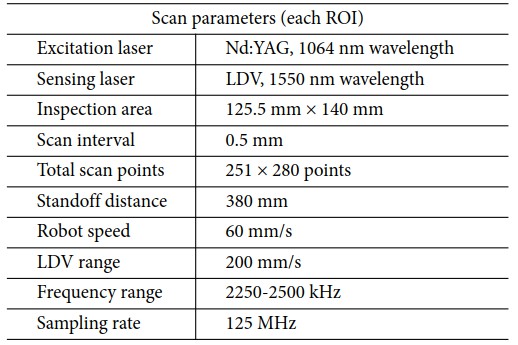
The robotic PUPI system was an effective inspection approach for 3D-printed composites [4]. It performs LUT in pulse-echo (PE) mode using bulk waves, providing flexibility on the size, shape and distance of the inspection target. During inspection (Fig. 5(a)), a Q-switched laser emits laser pulses for ultrasound excitation, while a laser Doppler vibrometer (LDV) detects the generated ultrasonic waves. The 6-axis robot arm movement is controlled based on specimen geometry data. A perpendicular sensing laser incident angle and constant standoff distance can then be maintained between the LDV and the inspection surface throughout the inspection to achieve high signal-to-noise ratios (SNR) in the ultrasound signals. The scan parameters used in this study are listed in Table 1. PE LUT provides depth-related information because internal interfaces affect the propagation and superposition of reflected ultrasonic signals. Previous robotic PUPI studies have demonstrated that variations in reflected waveform characteristics can be used to interpret internal conditions in 3D-printed composites [4]. However, distinguishing individual interfaces depends on the temporal separation of reflected signals and the measurement conditions. In the present study, under the 2250-2500 kHz measurement conditions and for the 3 mm multi-material wall thickness, the reflected responses from internal interfaces overlapped with the principal measured wave packet. Therefore, individual printed layers or internal interfaces could not be independently resolved. The expected void depths were inferred from the slicer-defined nominal Onyx/CF bead arrangement and nominal bead thicknesses, and the measured signals were interpreted as composite waveform responses reflecting the combined effects of internal conditions instead of layer-specific responses.
The external surface of the pusher cap CAD model was extracted as the geometry input for inspections from the external side. The CAD model-based scan path generation approach uses geometry data extracted from the STL (stereolithography) file used in 3D-printing [5]. Based on the shape, each pusher cap was inspected in quarters to cover the entire area in four inspections. To simplify the scan path, the CAD model was halved and had its openings filled as shown in Fig. 5(b). Scan grids were generated using the edited STL mesh, forming a common scan path that could be applied to all four regions of interest (ROIs) for both pusher caps (Fig. 5(c) and (d)). The inspection configurations for the 3, 6, 9, and 12 o’clock directions were identical, only the pusher cap orientation was changed so that each side faced the LDV beam.
|
Fig. 1 3D-printed composite pusher caps (a) Baseline (b) Fiber-misaligned |
|
Fig. 2 Schematic diagram of printer head |
|
Fig. 3 Pusher cap infill pattern in 3D printer slicing software |
|
Fig. 4 Expected internal conditions of pusher caps (a) Baseline: upper part (b) Baseline: lower part (c) Fiber-misaligned: upper part (d) Fiber-misaligned: lower part |
|
Fig. 5 Pusher cap inspection setup (a) Robotic PUPI system (b) Edited STL mesh (c) Four ROIs on a pusher cap (d) Scan grid output for each ROI (plots are scaled to provide visibility) |
3.1 VTWAM and averaged 1D ultrasonic signal interpretation
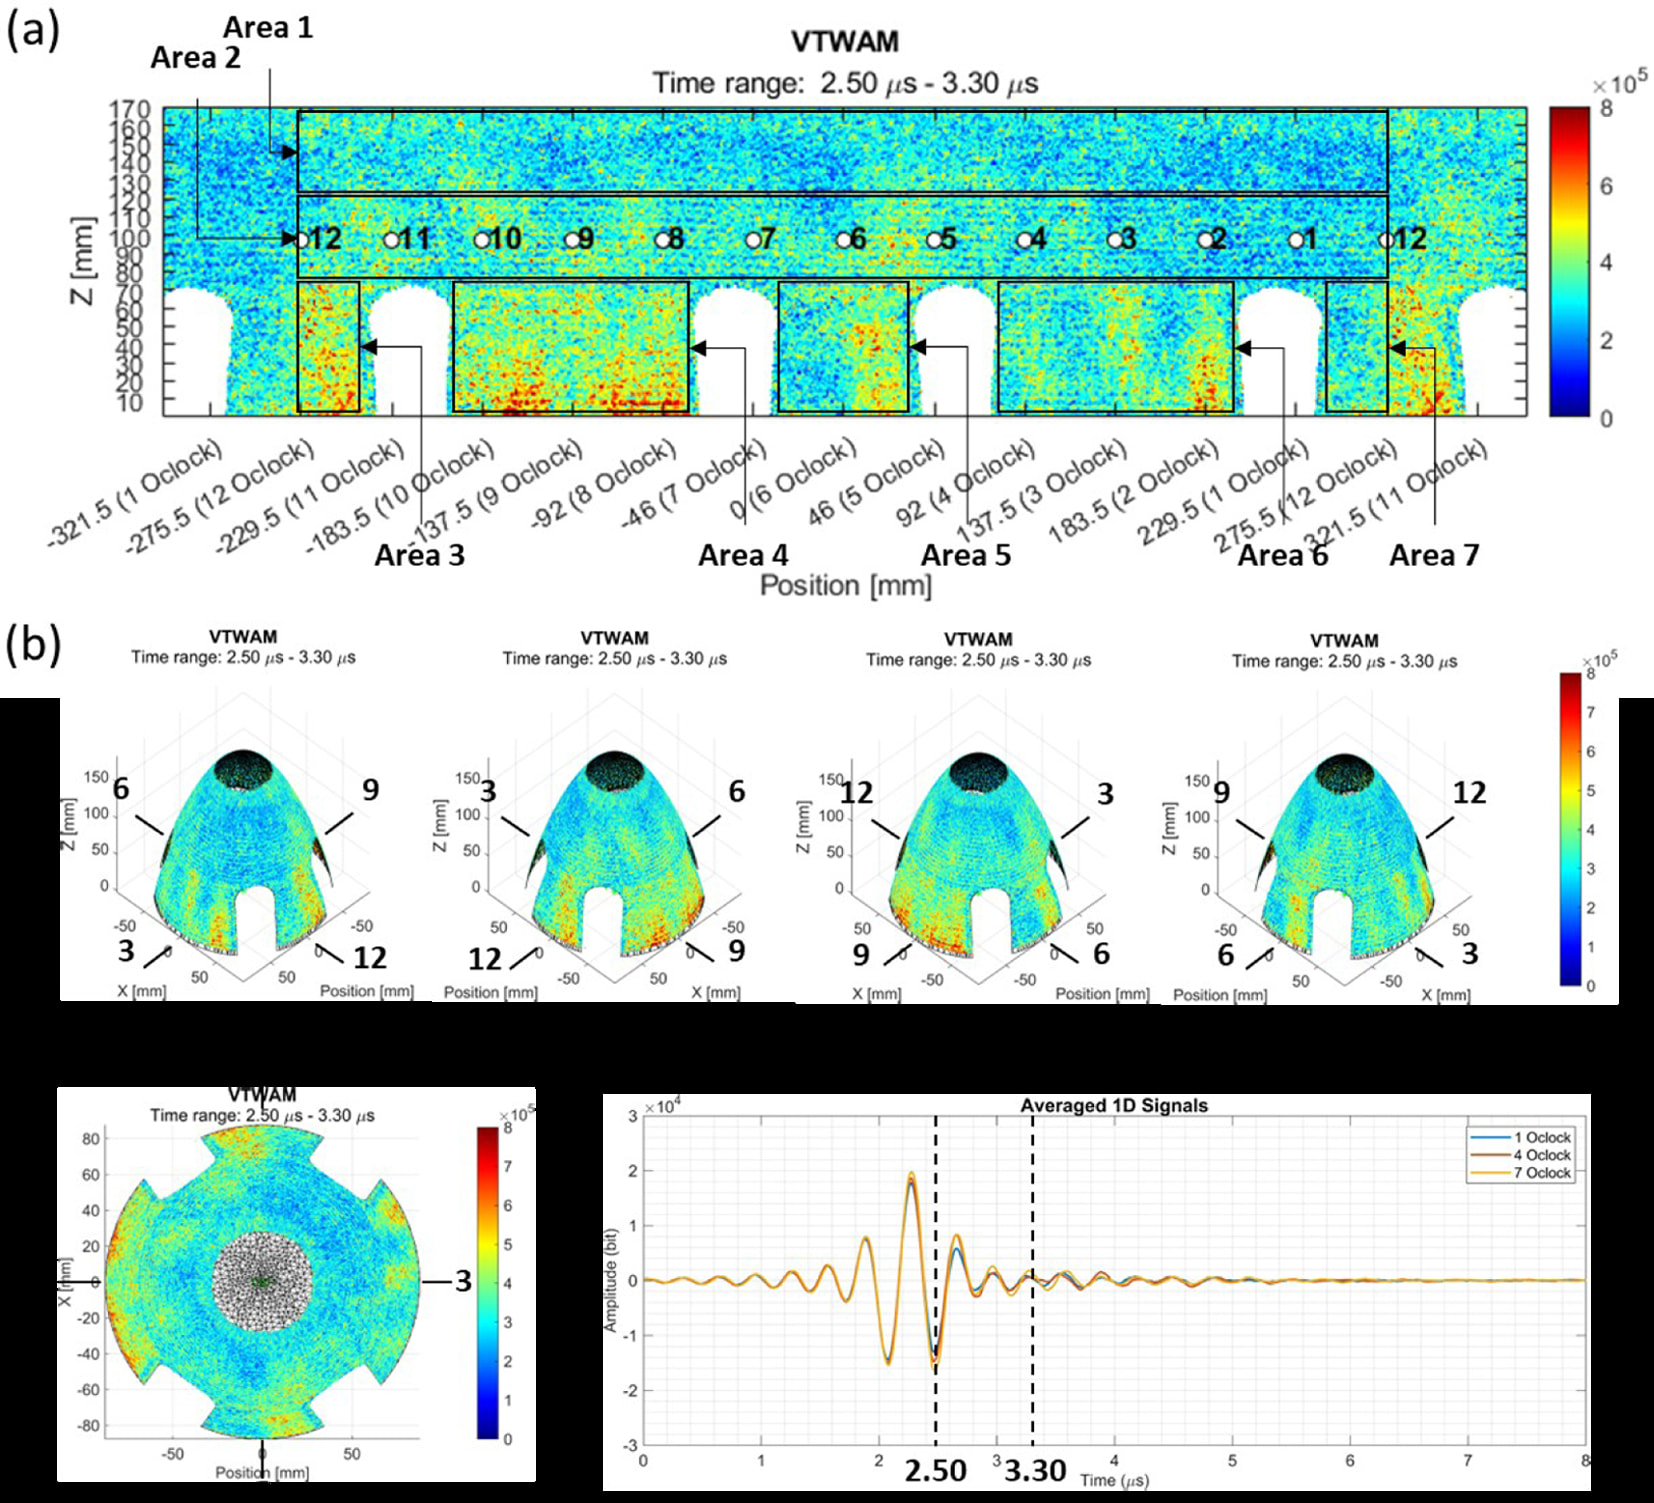
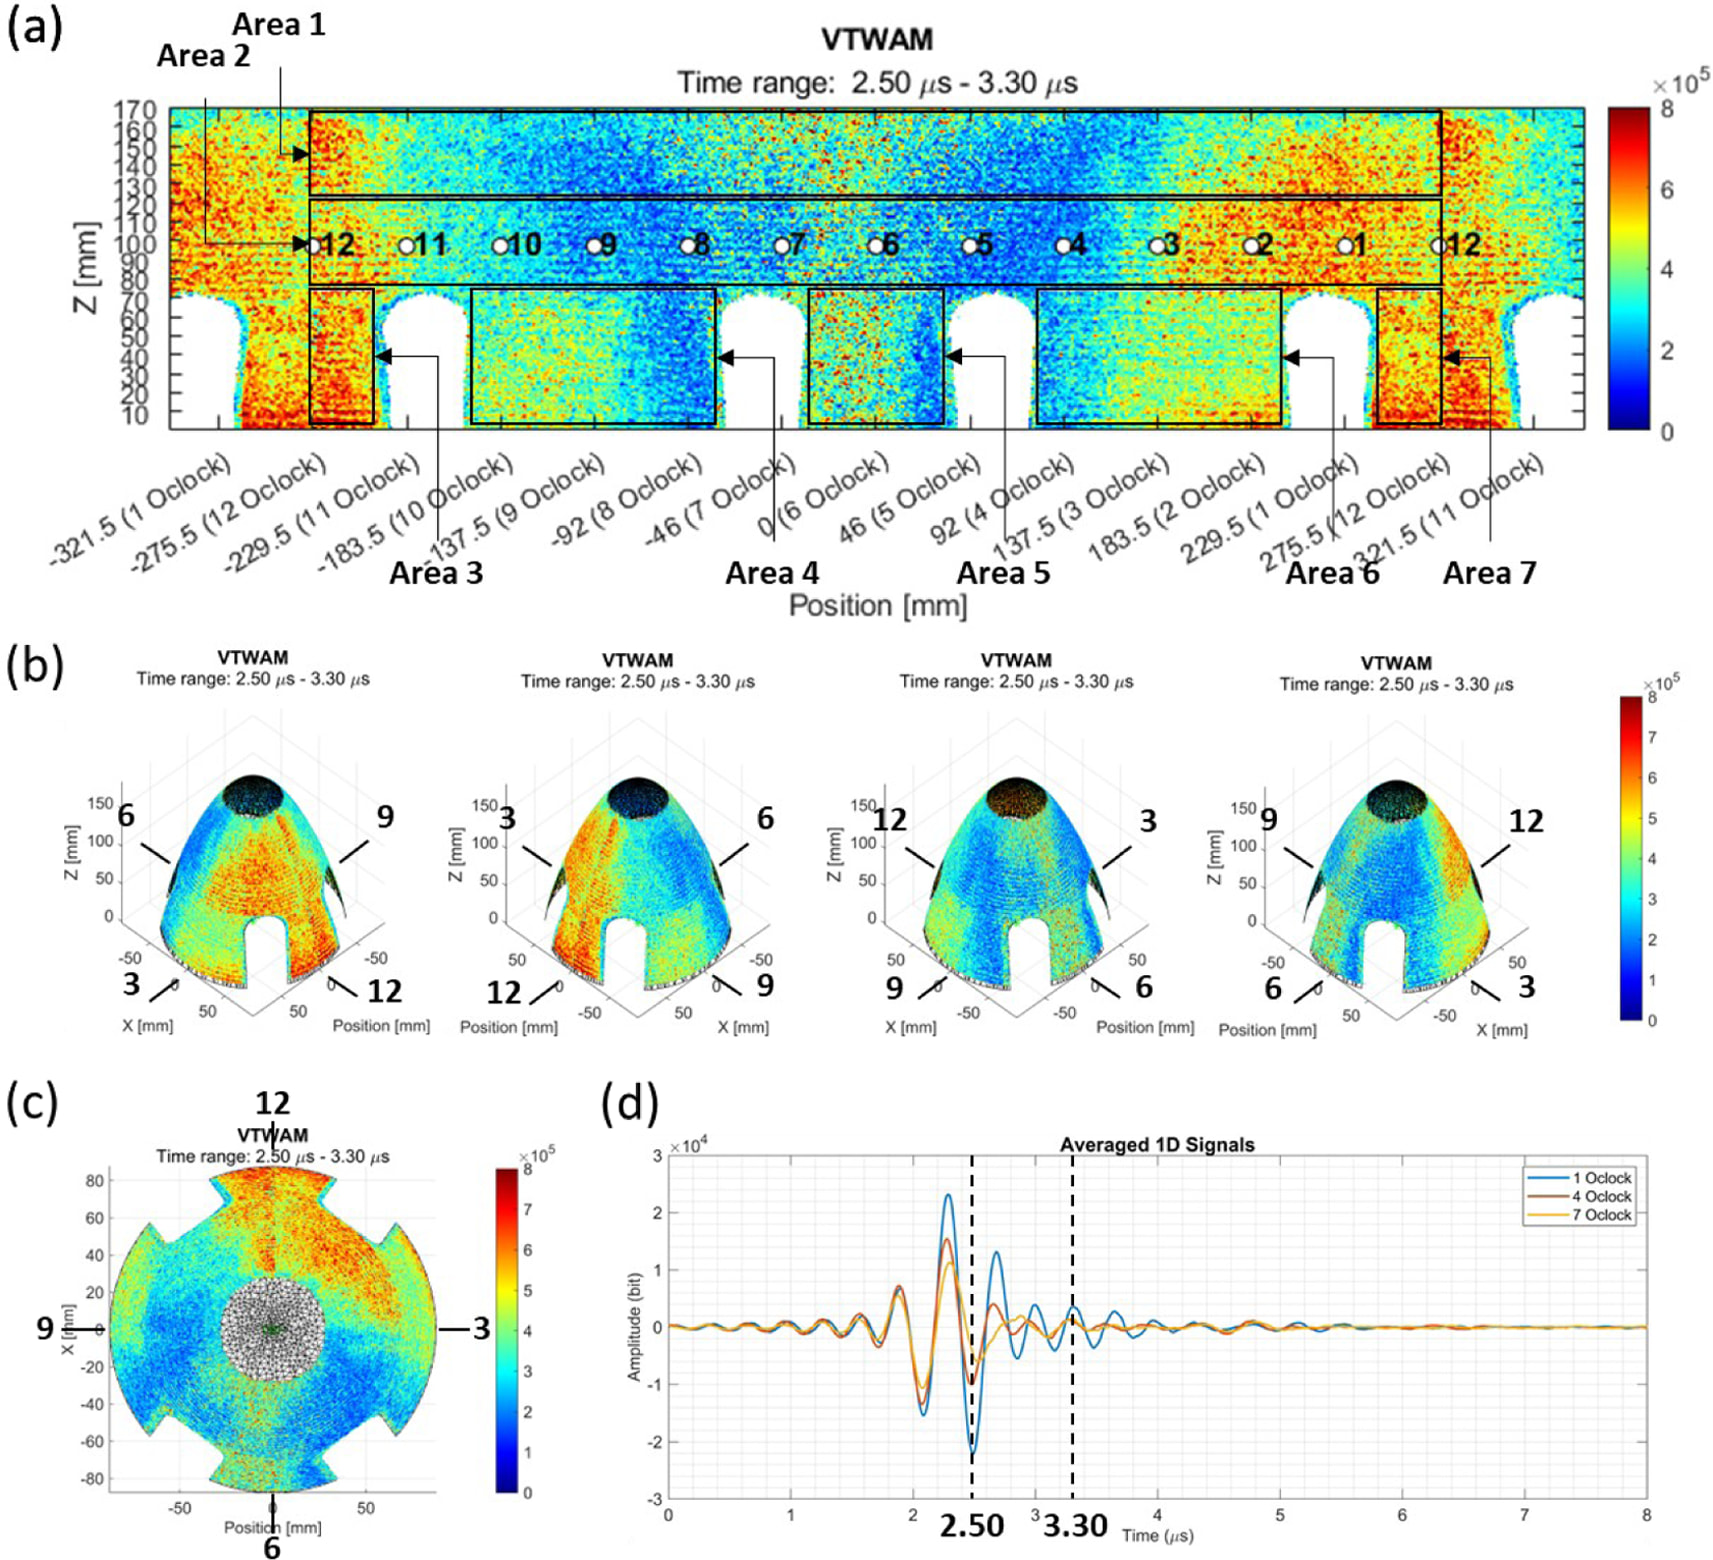
Ultrasonic Wave Propagation Imaging (UWPI) is a technique for visualizing ultrasonic wave propagation in the wall thickness direction. The 1D ultrasonic signals are arranged into a 3D data array to form a series of freeze frame images over time [7]. VTWAM combines the absolute amplitudes of UWPI freeze frames in a selected time window to maximize the visibility of the resulting image [8]. Fig. 6 and Fig. 7 exhibit the stitched 2D and 3D VTWAM plots of the baseline and fiber-misaligned pusher caps obtained from the inspection results. These combined plots provide an intuitive overview of the designated locations on the upper part where the averaged 1D ultrasonic signals (each averaged within a 5 mm × 5 mm area) were extracted.
To compare representative responses at different expected internal conditions, the upper 7 o’clock position was selected within the expected 6-8 o’clock medium-depth disbonding region, while the upper 1 o’clock position was selected within the expected 12-2 o’clock shallow disbonding region. The upper 4 o’clock position was selected as a relatively less affected region between them. Averaged 1D ultrasonic signals were extracted from these clock positions in both the baseline and fiber-misaligned pusher caps for comparison. Because the lower part contains segmented fiber loops and inherent inter-bead gap features, the detailed waveform interpretation in this section focuses on the selected upper part locations.
The baseline pusher cap was expected to have no void associated with intentional fiber nozzle misalignment at the upper part 1, 4, and 7 o’clock positions. The VTWAM plots in Fig. 6(a-c) showed similar signal amplitudes in terms of color representations in the 2.50-3.30 µs time window. The corresponding averaged 1D ultrasonic signals in Fig. 6(d) also showed similar waveform shapes, indicating similar ultrasonic wave propagation in the thickness direction.
In the fiber-misaligned pusher cap, additional variations caused by the intentionally misaligned fiber were observed in the VTWAM plots at the same 2.50-3.30 µs time window in Fig. 7(a-c). At the upper 1 o’clock region, voids between the Onyx wall and CF were expected to occur at approximately 0.4 mm depth. As shown in Fig. 7(d), the altered waveform and increased amplitude at the 1 o’clock position were interpreted as being consistent with superposition of the principal measured wave packet and a shallow interface response. At the upper 7 o’clock region, fiber misalignment-induced disbonding between the CF and Onyx infill was expected at approximately 1.4 mm depth, and the corresponding waveform showed a response different from the baseline waveform. In comparison, the upper 4 o’clock region showed a waveform closer to the baseline pusher cap, suggesting that the effect of fiber misalignment was relatively small at this location.
The baseline pusher cap showed relatively consistent VTWAM patterns and averaged 1D signals in the upper part, indicating similar ultrasonic wave propagation in the thickness direction at the selected clock positions. The fiber-misaligned pusher cap showed additional localized VTWAM patterns and waveform variations at the expected shallow and medium-depth disbonding regions, which were consistent with subsurface condition changes associated with the imposed fiber nozzle misalignment. These results suggest that the LUT results should be interpreted with respect to the slicer-defined fiber loop arrangement and expected subsurface conditions.
3.2 SNR-based measurement quality analysis
The SNR analysis was used to verify whether robotic PUPI inspection of pusher cap curved surfaces maintained sufficient measurement quality for interpreting the VTWAM and waveform results. SNR was calculated as the ratio between the peak-to-peak amplitude of the measured ultrasonic signal and the standard deviation of the noise in a signal-free time region, as expressed in Equation (1).

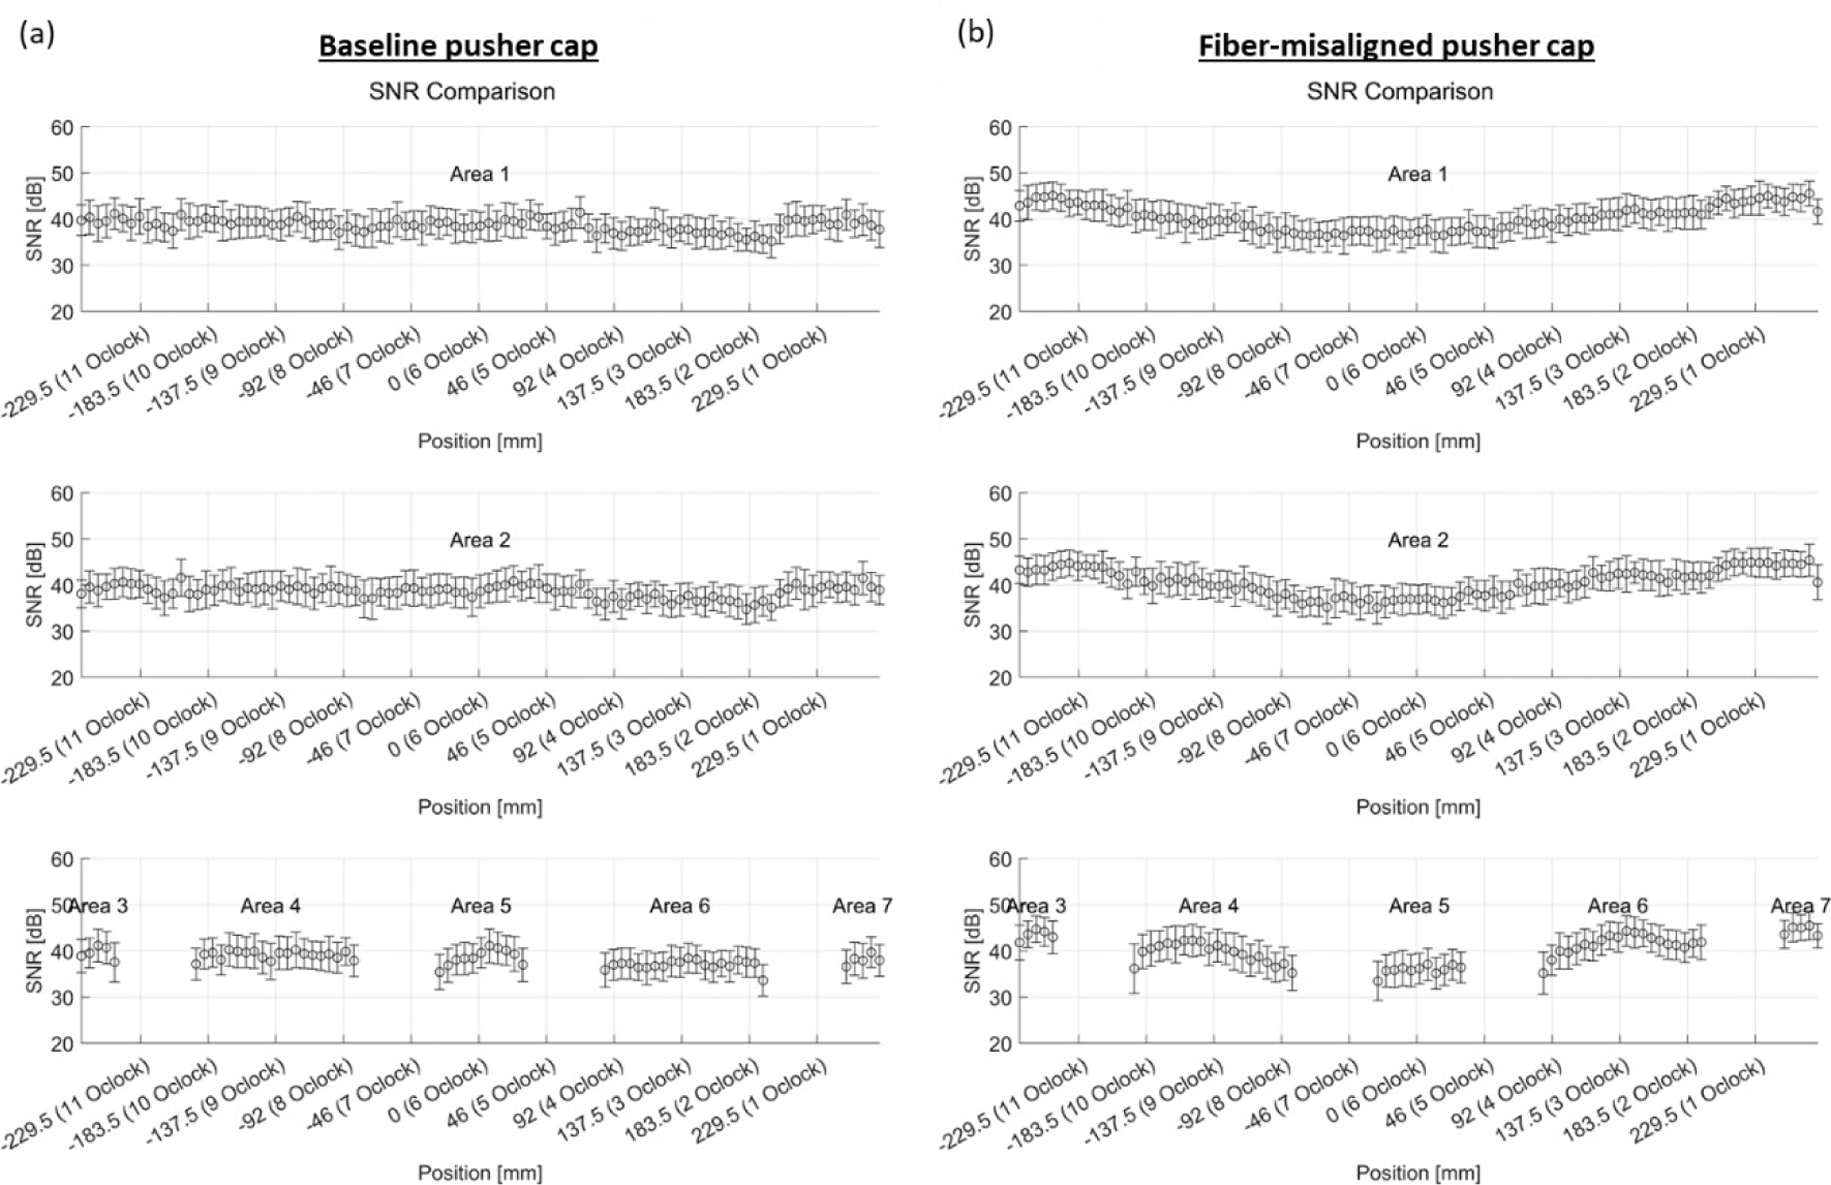
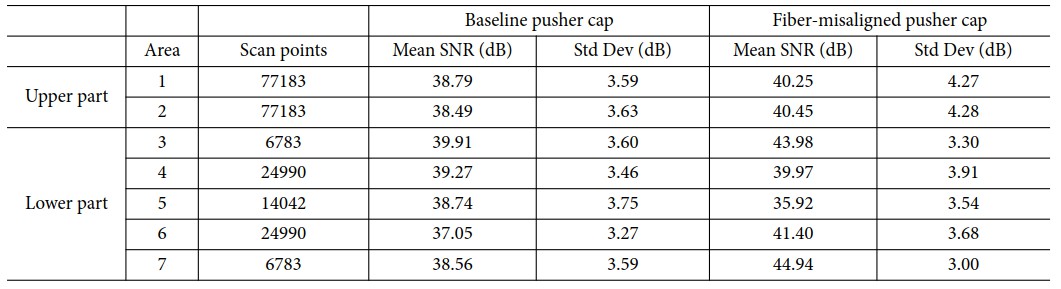
where A refers to the peak-to-peak amplitude of the entire acquired waveform and σ refers to the standard deviation of noise. The stitched inspection domain of each pusher cap was divided into seven areas, as indicated in in Fig. 6(a) and Fig. 7(a), to calculate the mean SNRs and standard deviations. The mean and standard deviation of the pointwise SNR values in each area are listed in Table 2. For Fig. 8, the SNR values were averaged over the height at 5 mm circumferential intervals, and the corresponding standard deviations were plotted as error bars.
In the baseline pusher cap, the mean SNRs ranged from 37.05 dB to 39.91 dB, with standard deviations ranging from 3.27 to 3.75 dB. As shown in Fig. 8(a), the height-wise mean SNRs slightly decreased at the edges of the lower part openings, probably because of the imperfect CF placement during U-turns at the opening edges. Overall, the baseline specimen maintained area-wise mean SNRs above 37 dB throughout the seven inspected areas.
In the fiber-misaligned pusher cap, the mean SNRs were between 35.92 dB and 44.94 dB, with standard deviations ranging from 3.00 dB to 4.28 dB. In addition to the drop near the lower part opening edges, Fig. 8(b) shows local SNR reduction around 6-8 o’clock region in both the upper and lower parts. The detected ultrasonic signals were likely affected by the local changes in surface roughness and optical reflectivity, where severely misaligned fibers protruded from the external surface. Area 5 in the lower part achieved the lowest mean SNR, which is consistent with the severe protruding-fiber condition in that region. In contrast, Area 7 located at the opposite side where fibers did not protrude on the Onyx outer wall, achieved the highest mean SNR.
Across both specimens, the area-wise mean SNRs remained above 35 dB, with standard deviations ranging from 3.00 to 4.28 dB. These results indicated that usable measurement quality was maintained over the curved inspection surface. Local SNR reductions in the fiber-misaligned specimen, especially near the protruding-fiber region, were associated with changes in surface roughness and optical reflectivity rather than with an apparent loss of robotic PUPI scan path control. The SNR results indicate that insufficient signal quality was unlikely to be the sole cause of the observed waveform differences. However, surface-optical effects and local manufacturing variability cannot be completely excluded.
3.3 Correlation-based quantification of waveform dissimilarity
Correlation coefficients have been used to compare the similarity of ultrasonic signal waveforms [9]. In this study, the waveform differences described in Section 3.1 were quantified using the correlation-based waveform dissimilarity D, defined in Equation (2).

where ρ is the Pearson correlation coefficient calculated between the baseline and fiber-misaligned averaged 1D signals at the same nominal clock position over the predefined 1-5 μs interval. No temporal shifting was applied before calculating the correlation. A value of D equals zero indicates perfectly correlated waveform shapes, while D increases as the waveform correlation decreases. Pearson correlation subtracts the mean from each signal and normalizes it by its standard deviation. Therefore, D is insensitive to a uniform signal offset and uniform positive amplitude scaling, but remains sensitive to differences in relative timing, phase, noise, and waveform shape. In this case, D is used as a descriptive matched-location waveform shape index for comparing the baseline and fiber-misaligned pusher caps.
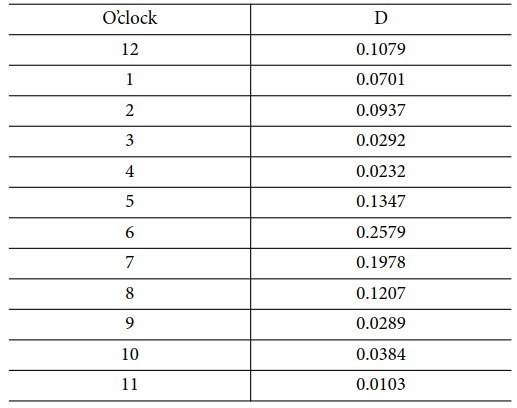
Table 3 lists the matched-location D values at the twelve upper part clock positions. At the 1, 4, and 7 o’clock positions discussed in Section 3.1, the D values were 0.0701, 0.0232, and 0.1978, respectively. For the descriptive group comparison, the 12, 1, and 2 o’clock positions represented the expected shallow Onyx wall/CF void condition, whereas the 6, 7, and 8 o’clock positions represented the expected medium-depth CF/Onyx infill void condition defined in Section 2.2 and Fig. 4 (Views A and C). The median D was 0.1143 for the six expected-condition positions (12, 1, 2, 6, 7, and 8 o’clock) and 0.0291 for the remaining six positions (3, 4, 5, 9, 10, and 11 o’clock). The higher D values in the expected-condition positions indicate greater waveform dissimilarity between the baseline and fiber-misaligned pusher caps at these locations. The median was selected to represent the central tendency of the sampled positions because it is less affected by isolated high values. The resulting median comparison indicates generally greater matched-location waveform dissimilarity at the expected-condition positions. However, these waveform differences may also be influenced by local manufacturing variability and surface measurement conditions.
|
Fig. 6 Baseline pusher cap inspection results (a) 2D VTWAM plot with clock positions labelled (b) 3D VTWAM plots at different views (c) 3D VTWAM plot top view (d) Averaged 1D ultrasonic signals at 1, 4, 7 o’clock designated areas |
|
Fig. 7 Fiber-misaligned pusher cap inspection results (a) 2D VTWAM plot with clock positions labelled (b) 3D VTWAM plots at different views (c) 3D VTWAM plot top view (d) Averaged 1D ultrasonic signals at 1, 4, 7 o’clock designated areas |
|
Fig. 8 Height-wise mean SNRs and standard deviation at 5 mm circumferential intervals in Area 1-7 (a) Baseline (b) Fiber-misaligned |
|
Table 2 Quantitative comparison of mean SNRs and standard deviations in Area 1-7 of pusher caps |
|
Table 3 Correlation-based waveform dissimilarity D at the twelve matched upper-part clock positions |
This study presented a process-informed case comparison of baseline and fiber-misaligned 3D-printed continuous CF composite pusher caps using robotic PUPI. The baseline pusher cap served as a nominal manufacturing comparator that included inherent printing features such as inter-bead gaps. The fiber-misaligned pusher cap showed additional localized VTWAM and waveform variations consistent with the shallow Onyx wall/CF and medium-depth CF/Onyx infill disbonding conditions. These conditions were not independently verified by micro-CT or destructive sectioning. The expected conditions were inferred from the nominal bead arrangement and imposed fiber nozzle misalignment. The SNR analysis indicated that sufficient measurement quality was maintained over the curved inspection surface. The local SNR reductions near protruding fibers also indicated that surface roughness and optical reflectivity influenced the measured signals. Therefore, interpretation of the robotic PUPI results should consider the CAD geometry, slicer-defined nominal fiber arrangement, expected manufacturing conditions, and local surface condition together. The matched-location waveform dissimilarity D was generally greater at the positions corresponding to the expected shallow and medium-depth conditions. Also, the higher median D observed at the expected-condition positions suggests that the imposed fiber nozzle misalignment produced localized waveform changes that were distinguishable from the nominal manufacturing response.
Only one baseline and one fiber-misaligned pusher cap, representing one intentionally imposed fiber nozzle misalignment condition, were inspected in this case study. Therefore, the present study does not establish part-to-part repeatability, a statistical detection threshold, probability of detection, or the minimum detectable degree of fiber misalignment. The relationship between the fiber-misalignment magnitude and the corresponding waveform response, as well as the minimum detectable defect size, requires further investigation using multiple controlled manufacturing conditions and independently characterized internal conditions. The 0.5 mm scan interval represents lateral spatial sampling and should not be interpreted as the minimum detectable defect size. CAD model-derived STL geometry has been applied to robotic PUPI of a 3D-printed UAV winglet [10], while 3D scan-derived STL geometry has been demonstrated for a non-planar CFRP specimen and an aircraft composite fairing tail cone [11]. These studies demonstrate that robotic PUPI scan paths can be generated for different curved geometries. However, the waveform response and detection performance would need to be evaluated separately for each material system, internal configuration, and specimen geometry. Even though CAD-based robotic PUPI can be adapted to asymmetric and irregular surfaces, it may still be constrained by factors such as the robot workspace and joint limits, collision avoidance, and geometric obstruction. Multiple scan orientations or auxiliary positioning stages may therefore be required for complete surface coverage of highly complex components.
In summary, this study presents an interpretation-based case comparison. Although statistically validated defect detection performance remains to be established through repeated experiments and direct defect validation, the results support the use of process information as an essential basis for interpreting robotic PUPI results of complex continuous fiber 3D-printed composite structures.
This research was supported by Unmanned Vehicles Core Technology Research and Development Program through the National Research Foundation of Korea (NRF) and Unmanned Vehicle Advanced Research Center (UVARC) funded by the Ministry of Science and ICT, the Republic of Korea (NRF-2020M3C1C1A01084220). This research was supported by the Space-K BIG Project Program funded by the Korea AeroSpace Administration (KASA) (Grant No. RS-2025-16063273). This work was supported by the National Research Foundation of Korea (NRF) grant funded by the Korean government (MSIT) in 2026 (Grant No. RS-2025-02213804, Project Title: In-Space Servicing and Manufacturing Research Center (ISMRC)).
- 1. Goh, G.D., Agarwala, S., Goh, G.L., Dikshit, V., Sing, S.L., and Yeong, W.Y., “Additive Manufacturing in Unmanned Aerial Vehicles (UAVs): Challenges and Potential,” Aerospace Science and Technology, Vol. 63, 2017, pp. 140-151.
-

- 2. Lee, K.-J., Jeon, M.-S., and Lee, J.-R., “Evaluation of Manufacturing Defects in 3D Printed Carbon Fiber Reinforced Cylindrical Composite Structure Based on Laser Ultrasonic Testing,” NDT & E International, Vol. 135, 2023, Article No. 102802.
-
- 3. Che, X., Xin, R., and Goo, N.S., “Experimental and Numerical Study on of 3D Printed Carbon Fiber Composite Cylindrical Shell Under Axial Loading,” International Journal of Aeronautical and Space Sciences, Vol. 26, No. 5, 2025, pp. 2309-2329.
-
- 4. Lee, K.-J., and Lee, J.-R., “Path Planning and Inspection of Complex-shaped 3D-Printed Composites Based on Robotic Pulse-Echo Laser Ultrasonic Testing,” Advanced Composite Materials, Vol. 34, No. 2, 2025, pp. 329-351.
-
- 5. Ma, K.S., Lee, K.-J., and Lee, J.-R., “Development of CAD Model-Based Robotic Pulse-Echo Laser Ultrasonic Testing Method for 3D-Printed Composites,” Proceeding of the Korean Society for Aeronautical and Space Sciences Conference, Gangwon, Korea, Nov. 2024, pp. 148-149.
-
- 6. Cho, S.-Y., and Lee, J.-R., “Investigation of Manufacturing Defects in 3D-Printed CFRP Using Laser Ultrasonic Testing and X-Ray Micro-Computed Tomography,” Functional Composites and Structures, Vol. 3, No. 2, 2021, pp. 025005.
-
- 7. Lee, J.-R., Jeong, H., Chia, C.C., Yoon, D.-J., and Lee, S.-S., “Application of Ultrasonic Wave Propagation Imaging Method to Automatic Damage Visualization of Nuclear Power Plant Pipeline,” Nuclear Engineering and Design, Vol. 240, No. 10, 2010, pp. 3513-3520.
-
- 8. Lee, J.-R., Chia, C.C., Park, C.-Y., and Jeong, H., “Laser Ultrasonic Anomalous Wave Propagation Imaging Method with Adjacent Wave Subtraction: Algorithm,” Optics & Laser Technology, Vol. 44, No. 5, 2012, pp. 1507-1515.
-
- 9. Cepel, R., Ho, K.C., Rinker, B.A., Palmer, D.D., Lerch, T.P., and Neal, S.P., “Spatial Correlation Coefficient Images for Ultrasonic Detection,” IEEE Trans. Ultrason. Ferroelectr. Freq. Control, Vol. 54, No. 9, 2007, pp. 1841-1850.
-
- 10. Ma, K.S., Lee, K.-J., Chia, C.C., and Lee, J.-R., “CAD Model-based Robotic Pulse-echo Ultrasonic Propagation Imaging for 3D Printed Composites and Data Acquisition for AI-based Defect Diagnosis,” Journal of the Korean Society for Nondestructive Testing, Vol. 46, No. 2, 2026, pp. 106-112.
-
- 11. Ma, K.S., Lee, K.-J., and Lee, J.-R., “A Study on 3D Scan-based Robot Arm Control Approach for Pulse-echo Laser Ultrasonic Testing of Curved Composite Structures,” Meas. Sci. Technol., Vol. 36, No. 4, 2025, p. 045903.
-
 This Article
-
2026; 39(4): 312-321
Published on Aug 31, 2026
- 10.7234/composres.10.7234/composres.2026.39.4.312
- Received on May 20, 2026
- Revised on Jul 24, 2026
- Accepted on Aug 22, 2026
Services
- Abstract
1. introduction
2. methodology
3. results and discussions
4. conclusions
- Acknowledgements
- References
- Full Text PDF
Shared
Correspondence to
- Jung-Ryul Lee
-
Department of Aerospace Engineering, KAIST
- E-mail: leejrr@kaist.ac.kr
 Copyright ⓒ The Korean Society for Composite Materials. All rights reserved.
Gangnam Mirae Tower, Suite 601, 174 Saimdang-ro, Seocho-gu, Seoul 06627, South Korea
Tel: +82-2-598-1550 Fax: +82-2-598-1557 E-mail: composites@kscm.re.kr