


- Fatigue Life Prediction of Laminated Composite Materials by Multiple S-N Curves and Lamina-Level Failure Criteria
Hangil You*, Dongwon Ha*, Young Sik Joo**, Gun Jin Yun*†
* Department of Aerospace Engineering, Seoul National University, Seoul 08826, Korea
** Aerospace Technology Research Institute, Agency for DefenseThis article is an open access article distributed under the terms of the Creative Commons Attribution Non-Commercial License (http://creativecommons.org/licenses/by-nc/4.0) which permits unrestricted non-commercial use, distribution, and reproduction in any medium, provided the original work is properly cited.
In this paper, we present a fatigue life prediction methodology using multiple S-N curves according to the different stress states of laminated composites. The stress states of the plies of the laminated composites are classified into five modes: longitudinal tension or compression and transverse tension or compression, and shear according to the maximum stress criterion and Puck's criterion with a scaling factor K. This methodology has advantages in computational cost, and it can also consider microstructural characteristics of the composites by applying different S-N curves. The S-N curves for the fatigue analysis are obtained by experimental fatigue test. The proposed methodol is implemented into commercial software, ABAQUS user material subroutine and therefore, the fatigue analysis is conducted using the structural analysis results. The finite element (FE) simulation results are presented for unidirectional composites with and without open-hole. The FE simulation results show that the stress condition is different depending on the fiber orientation of the unidirectional composite, so the fatigue life is calculated with different S-N curves
Keywords: Composite Fatigue analysis, Puck's criterion, Unidirectional Composite, Multiple S-N curves
The fatigue-related research began in earnest with the advent of the industrial revolution, and therefore research on metal materials was mainly conducted in the early days [1]. These fatigue-related studies are primarily divided into fatigue life prediction methods from a macroscopic point of view that relies on cumulative fatigue damage theory and fatigue life prediction methods from a microscopic point of view that relies on fracture mechanics [2-4]. In the case of the fatigue life prediction method, from a macroscopic point of view, a practical solution is presented for the fatigue life of a structure that endures millions of cycles using the S-N curve, but it has a drawback such as extensive experimental tests are required [5]. On the other hand, in the case of the microscopic fatigue life prediction method, crack propagation is simulated considering fracture mechanics, or material property degradation is expressed through material damage parameters. These fatigue life prediction methods can be seen as having a trade-off relationship between accuracy and calculation time. However, as composite materials are widely used, it is necessary to predict the fatigue life of non-metallic materials. In the fatigue damage model and life prediction method, the traditional theory derived from metal fatigue research is closely related to plasticity, so it is unsuitable for fatigue analysis of composite materials. It has limitations in that it does not reflect microstructural characteristics. Therefore, research on the fatigue of composite materials is in progress [6-9]. The mechanical behavior of Fiber-reinforced composites differs from metals as it depends on the properties of their constituent elements [10]. Fatigue failure in composites is challenging to analyze because many damage mechanisms interact, such as fiber delamination [11-13], fiber breakage [14-16], and matrix degradation [17-19]. Therefore, many fatigue modeling methodologies for fiber-reinforced composites are presented in the literature. However, previous studies on fiber-reinforced composite materials have limitations in industrial applications due to high computational costs that accurately consider mechanics. This paper is meaningful in overcoming the last restriction on the practical usage of composite fatigue life prediction. This paper presents a fatigue life prediction methodology that utilizes multiple S-N curves according to the different stress states for laminated composites. This methodology has advantages in computational cost, and it can consider microstructural characteristics of composite material by using multiple S-N curves according to the given stress condition. In addition, due to its fast computation, it can provide a practical solution for predicting the fatigue life of the finite element model of laminate composite. Section 2 introduces Puck's criterion and failure criterion for activating the fatigue flag and the algorithmic steps of the proposed model. The material properties and experimental S-N curve results are also explained. Section 3 introduces fatigue analysis results using finite element simulations.
2.1 Fatigue Analysis Methodology
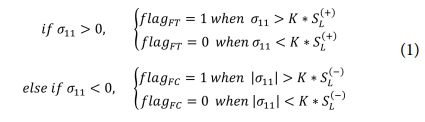
In the case of unidirectional composites, the material properties vary depending on the longitudinal or transverse direction, and the tensile or compressive modulus is also different. Therefore, fatigue properties also depend on the fiber orientation and the direction of the force acting on the unidirectional composites. To reflect the dependent fatigue characteristics of the uniaxial fatigue, the stress state was classified into five fatigue modes using the maximum stress criterion and the puck criterion, and different S-N curves were applied for fatigue analysis. For the longitudinal tension and compression dominant stress state, the maximum stress criteria shown in Eq. (1) are applied to determine which S-N curve is according to the stress state. Herein, the flag is a parameter to activate the S-N curve while subscript FT, FC fatigue mode. σ11, K are the longitudinal stress scale factor. In this paper, K is set as 0.1. While SL(+) and SL(+) are the longitudinal tensile strength and longitudinal compressive strength.
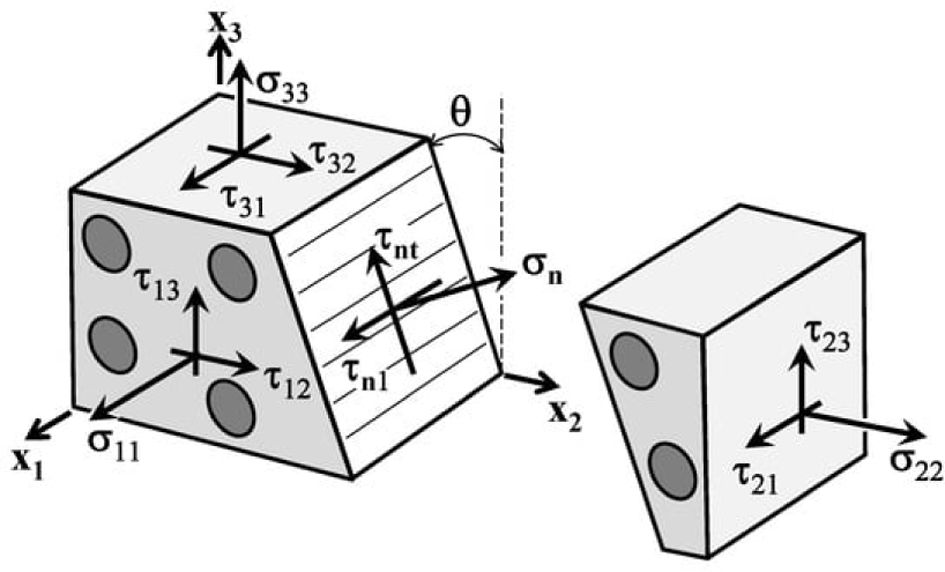
Puck's criteria are applied for the transverse tension or compression dominant stress state to determine which matrix failure mode will occur according to the stress state. Fig. 1 shows the action plane that the stress exposure fE(θ) is maximized. The action plane is determined by the angle q between the XY-plane and the action plane.
Eq. (2), (3), and (4) show the stress exposure fE(θ) value calculation that depends on the sign of σn. Herein, RL(+), RL(-), RL are the residual strengths in the transverse tension, transverse compression, and the shear direction, respectively. RLLA is the fracture resistance resulting from transverse and shear
loading that is determined as 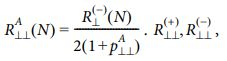
 are inclination values for the failure envelope.
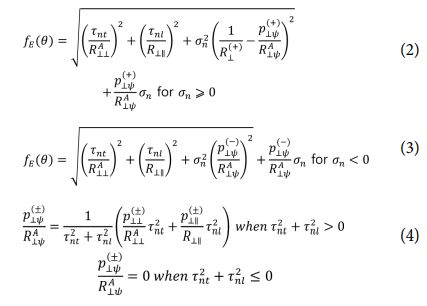
The θ that results in high-stress exposure value ffp(θ), fracture plane θf is determined. In this research, f(θ) is estimated at 1° interval from θ=-90° to 89°. Eq. (2), (3), and (4) correspond to failure mode A, mode B, and mode C, respectively. The S-N curve flag is determined as:
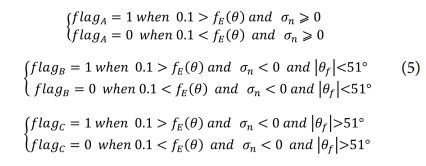
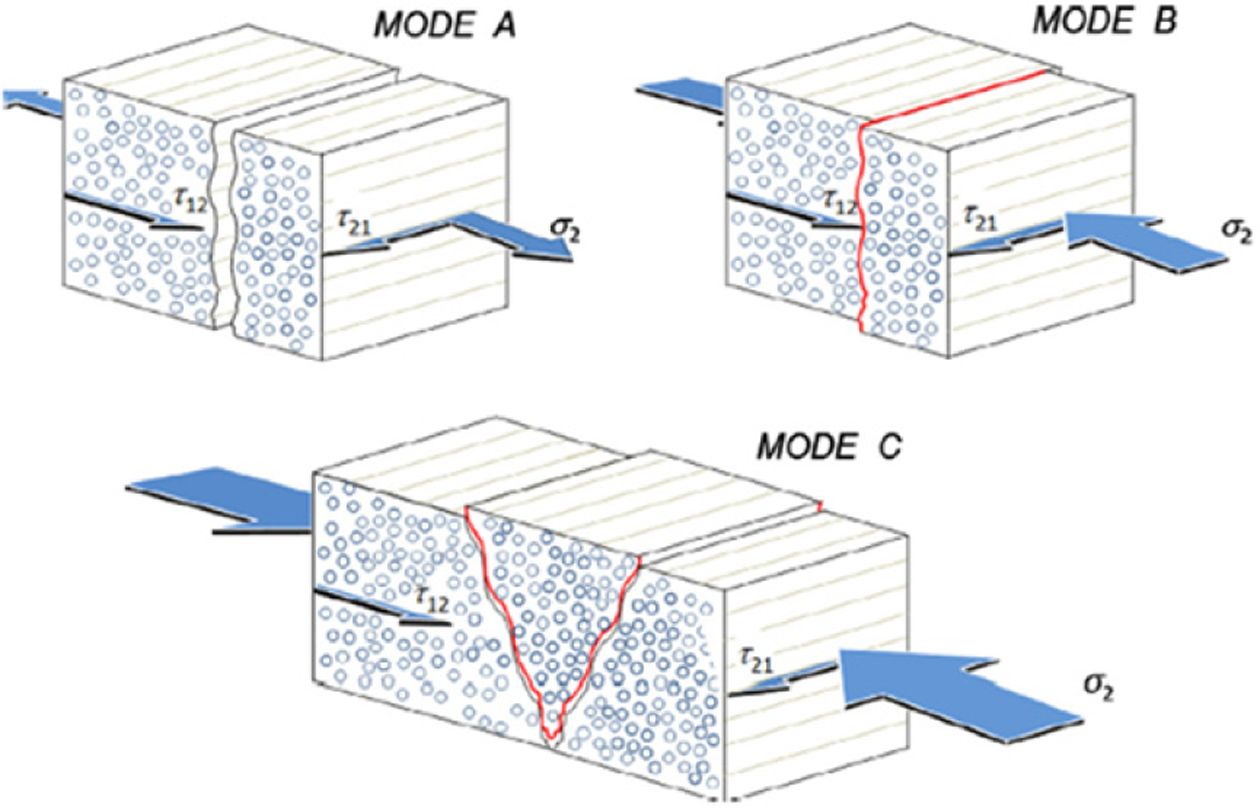
Fig. 2 shows the schematic view of the inter-fiber failure modes according to Puck's criteria. It shows that a different stress state causes each mode of inter-fiber failure. Specifically, Mode A is caused by transverse tension, Mode B by transverse compression, and Mode C by transverse compression and shear. Therefore, the fatigue properties are different in each stress state. Different S-N curves are used depending on the failure mode flag to estimate the fatigue life.
2.2 Algorithmic Steps for the Proposed Model
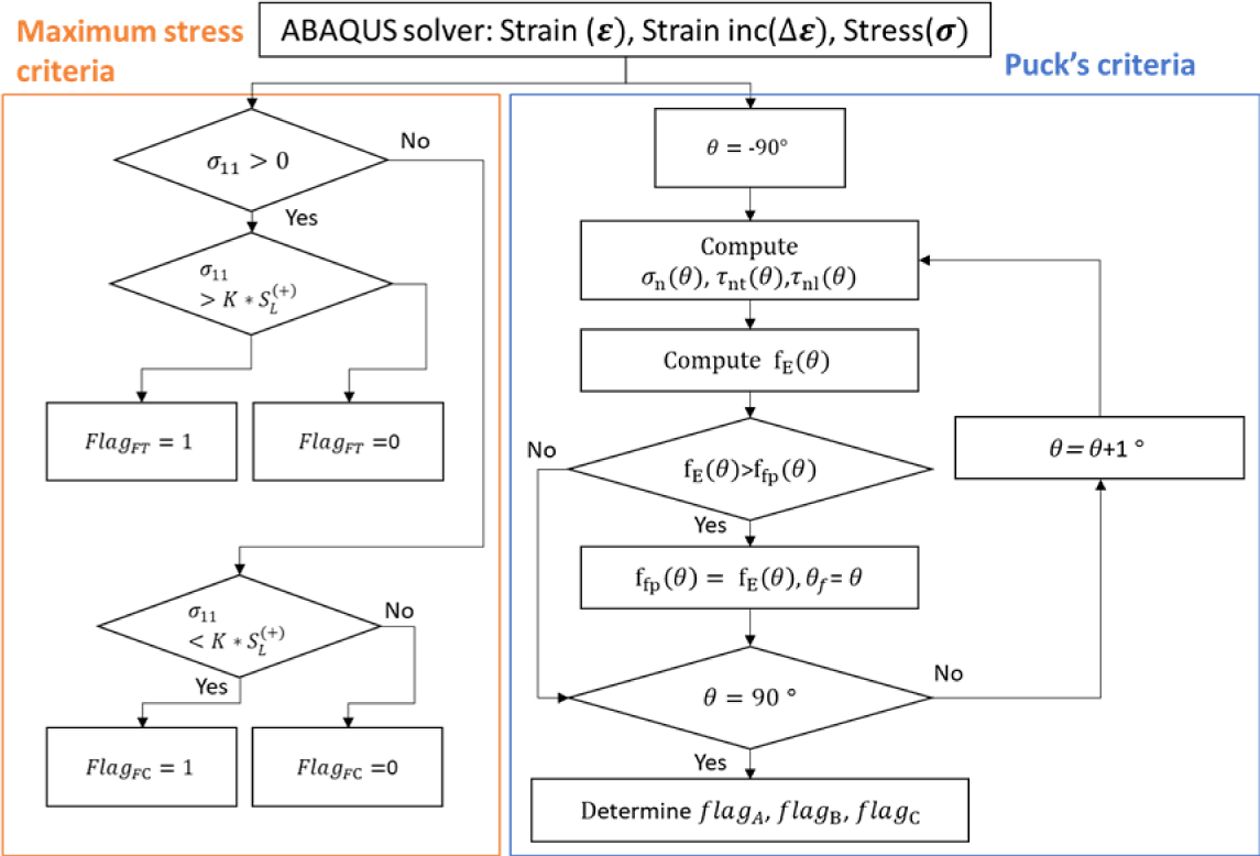
The proposed fatigue prediction model is implemented into commercial software ABAQUS user-defined material model for practical usage. Fig. 3 shows the algorithmic step to determine fatigue mode. The fatigue mode is determined by the stress information provided by the ABAQUS solver. After fatigue mode is selected, the S-N curve corresponding to each mode is used to estimate fatigue life.
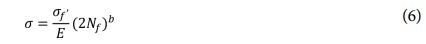
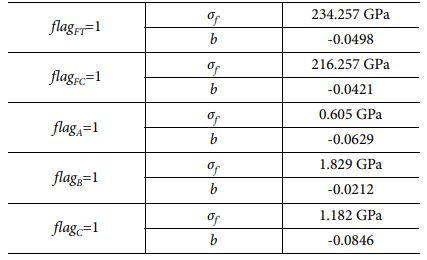
The fatigue life is obtained using the empirical uniaxial fatigue model shown in Eq. (6). Herein, σf', is the fatigue strength coefficient and b is the fatigue strength exponent. These parameters are obtained by fitting experimental data. The experimental S-N curve is obtained for each failure mode. For stress s, longitudinal stress component is used for flag condition flagFT=1 or flagFC=1 while transversal stress component is used for flag condition flagA=1 or flagB=1 or flagC=1.
2.3 Material Properties and Experimental S-N Curve
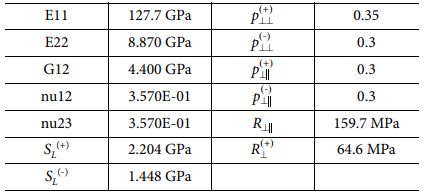
The material properties used for the simulation is obtained by experimental test and literature. Table 1 shows the material properties and used value in this research.
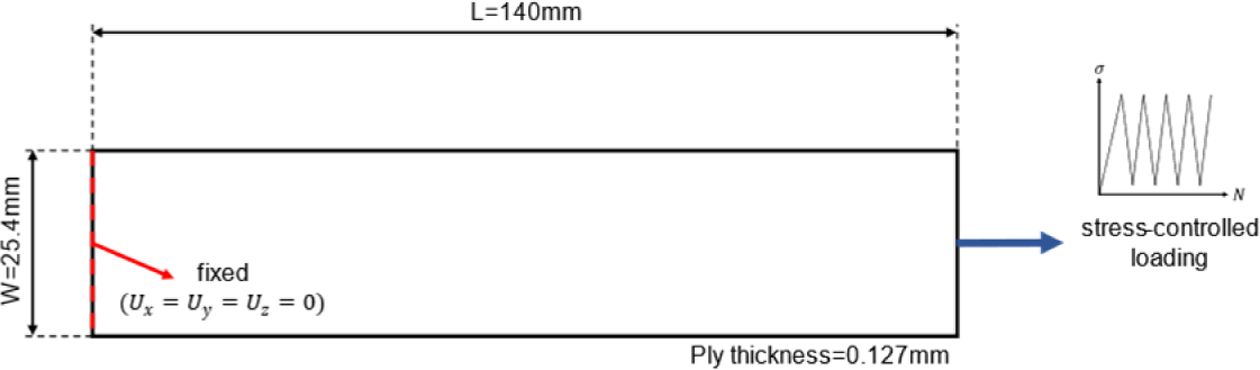
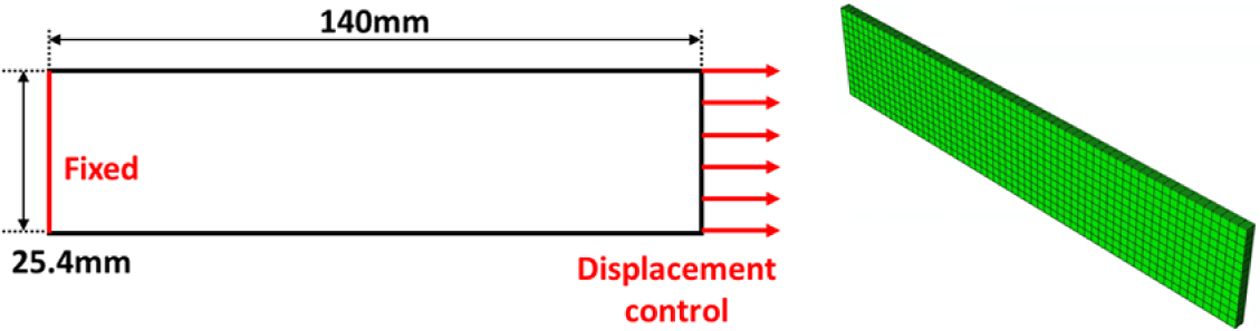
The material properties used for the simulation is obtained by experimental test and literature. Table 1 shows the material properties and used value in this research. Fig. 4 shows the experimental setup for the fatigue test. The dimensions of the unidirectional laminate are 140 mm long, 25.4 mm wide, and 0.127 mm thick. The laminate consists of 8 layers.
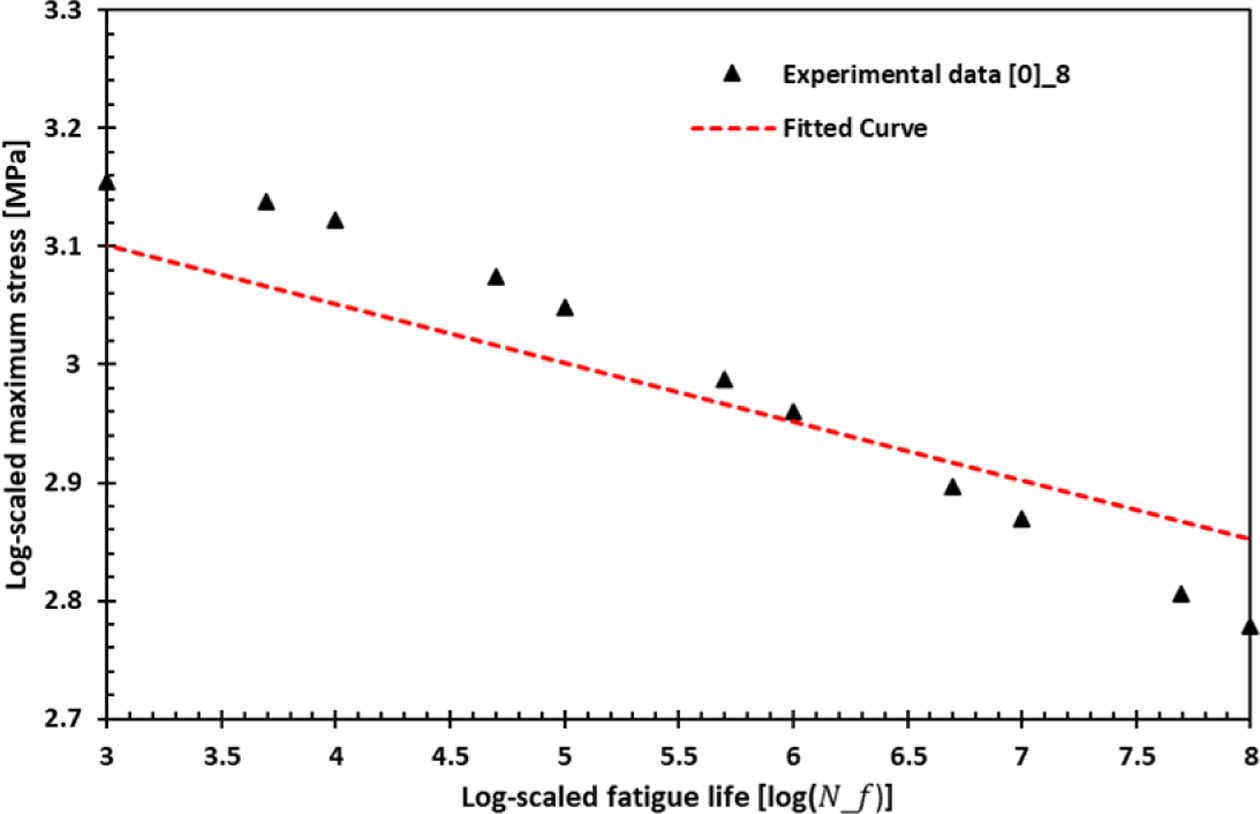
Fig. 5 shows the log-scaled experimental fatigue data and fitted S-N curve for longitudinally aligned ([0]8) laminate composite. In the case of tensile load in the longitudinal direction, the stress state in the longitudinal direction is dominant and causes flagFT=1. Therefore, when flagFT=1, the fatigue life is predicted using the S-N curve obtained from the longitudinal tensile load fatigue test.
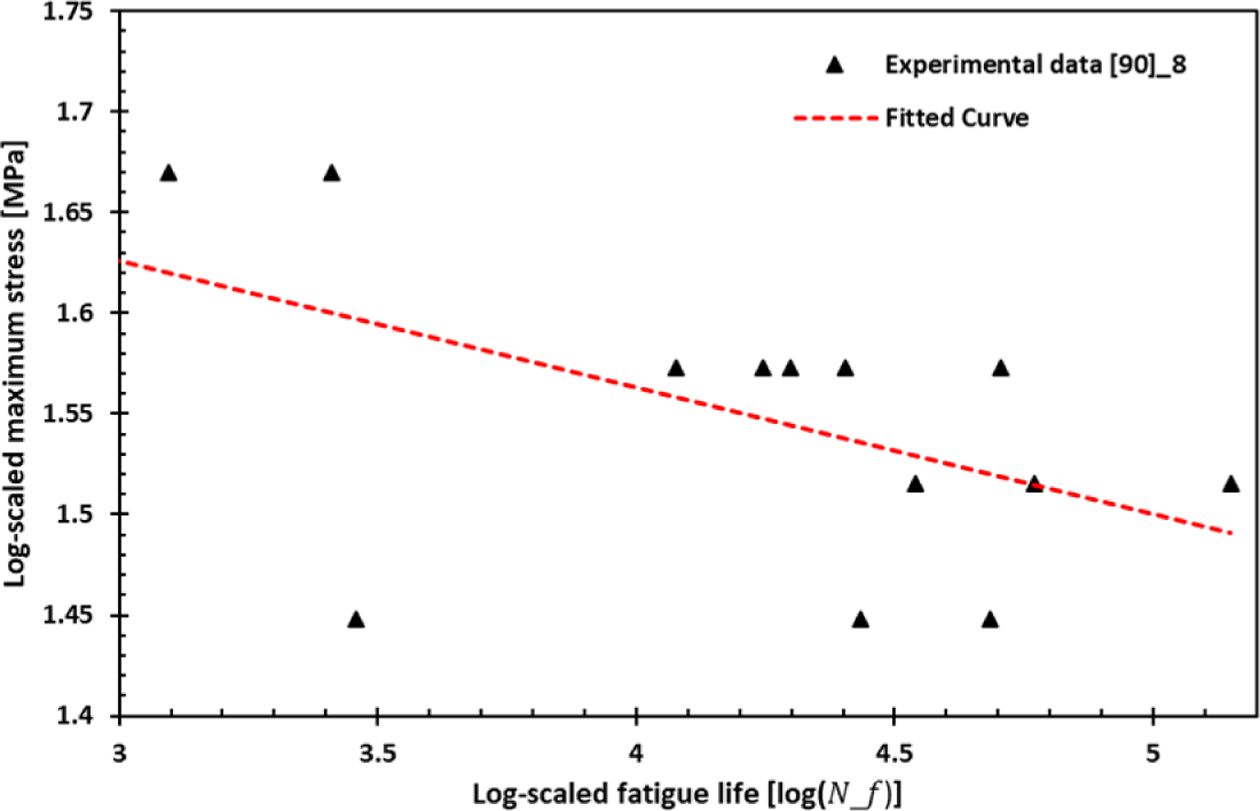
Fig. 6 shows the log-scaled experimental fatigue data and fitted S-N curve for transversely aligned ([90]8) laminate composite. There is a difference of about 100 to 1000 times in the stress magnitude between the longitudinally and transversely aligned composites. In the case of tensile load in the transverse direction, the stress state in the transverse direction is dominant and causes flagA=1. Therefore, when flagA=1, the fatigue life is predicted using the S-N curve obtained from the transverse tensile load fatigue test.
Another fatigue test is conducted for longitudinal, transverse, and transverse shear loading conditions. The S-N curve obtained by longitudinal compression is used when flagFC=1 while the S-N curve obtained by transversal compression and shear is used when flagB=1 and flagC=1, respectively. The fatigue life greater than 107 is calculated as a 107 fatigue life as a default value.
Table 2 shows the fatigue properties corresponding to each mode by curve-fitting the S-N curve obtained through the experimental fatigue test.
|
Fig. 1 Schematics of stress component in action plane [20] |
|
Fig. 2 Schematics of Inter-fiber failure mode according to Puck's criteria [21] |
|
Fig. 3 Algorithmic flowchart for fatigue mode determination |
|
Fig. 4 Experimental set-up of fatigue experiment |
|
Fig. 5 Experimental data obtained by fatigue test for longitudinally aligned ([0]8) laminates. (Log-scaled) |
|
Fig. 6 Experimental data obtained by fatigue test for transversally aligned ([90]8) laminates. (Log-scaled) |
The proposed fatigue life prediction methodology is implemented into ABAQUS UMAT to conduct the fatigue analysis using structural analysis results. The fatigue life is calculated and saved as a state-dependent variable in the result file. The FE simulation results of the composites specimen with and without open-hole are presented in this section. In the case of a model without an open-hole, the fatigue life of each ply with different fiber orientation was checked for general laminated composites. In the case of the open-hole model, fatigue life were shown in each ply with different fiber orientations under stress concentration conditions.
3.1 Fatigue Analysis for Laminated Composites
3.1.1 Model Description
Fig. 7 shows the schematics of load & boundary conditions applied on the composite and FE model without an open hole. A total of 28000 C3D8 elements are used, and load & boundary conditions are applied on the specimen's left and right sides. The 0.03 strain of longitudinal direction is applied. The layer up of the laminate composites is [904/04].
3.1.2 Fatigue Analysis Results
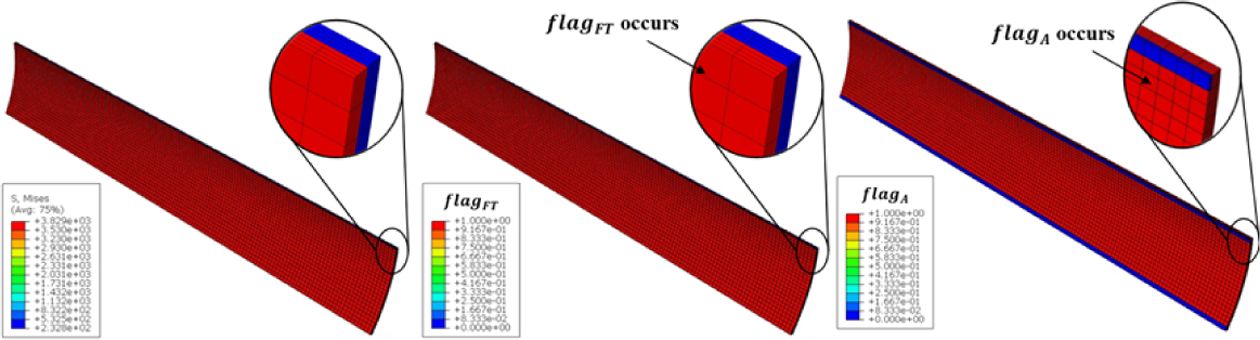
Fig. 8 shows the stress analysis result and corresponding fatigue flag. flagFC, flagB, flagC is not activated. The results show that the stress is dominant in longitudinally aligned layers. However, the fatigue flag flagA is activated on transversally aligned layers. It is because transverse tension is applied to the transversely aligned layers, and fatigue mode A arises from transverse tension. On the other hand, flagFT occurred only in the longitudinally aligned layer due to longitudinal tension.
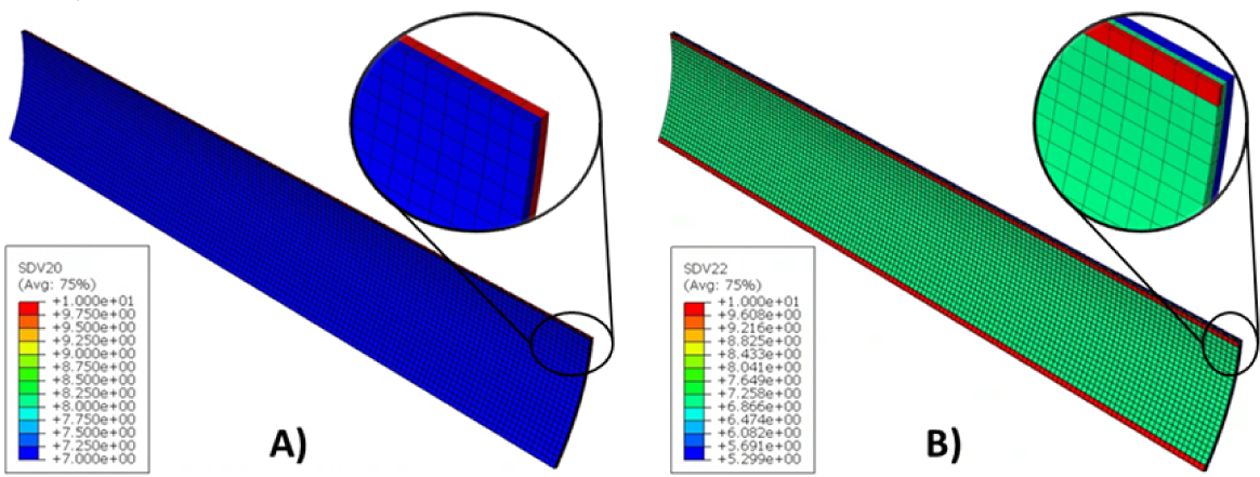
Fig. 9 shows that the fatigue life prediction results correspond to the fatigue flag. Fig. 9A) shows the fatigue life prediction result when flagFT is activated and Fig. 9B) shows the fatigue life prediction result when flagA is activated. The fatigue life when flag is not activated is set to be 1010. This result shows that the stress magnitude is more significant in longitudinally aligned layers [04] but the fatigue life is shorter in transversally aligned layers [904]. Because the minimum fatigue life in transversally aligned layers [904] is 105.299 while minimum fatigue life in longitudinally aligned layers [04] is 107 (default value since calculated fatigue life using fatigue properties is greater than 107).
3.2 Fatigue Analysis for Laminated Composites with Open-hole
3.2.1 Model Description
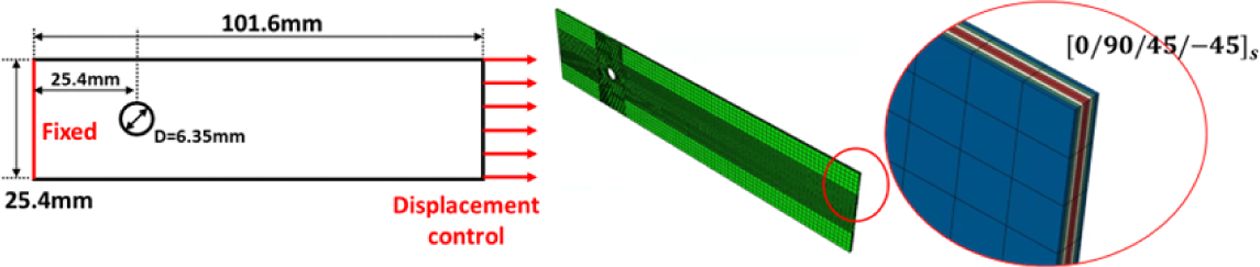
Fig. 10 shows the schematics of load & boundary conditions applied on the composite and FE model with an open hole. A total of 51,813 C3D8 elements is used, and the same load & boundary condition is applied on the left and right sides of the specimen. The layer up of the laminate composites is ([0/90/45/-45]s).
3.2.2 Fatigue Analysis Results
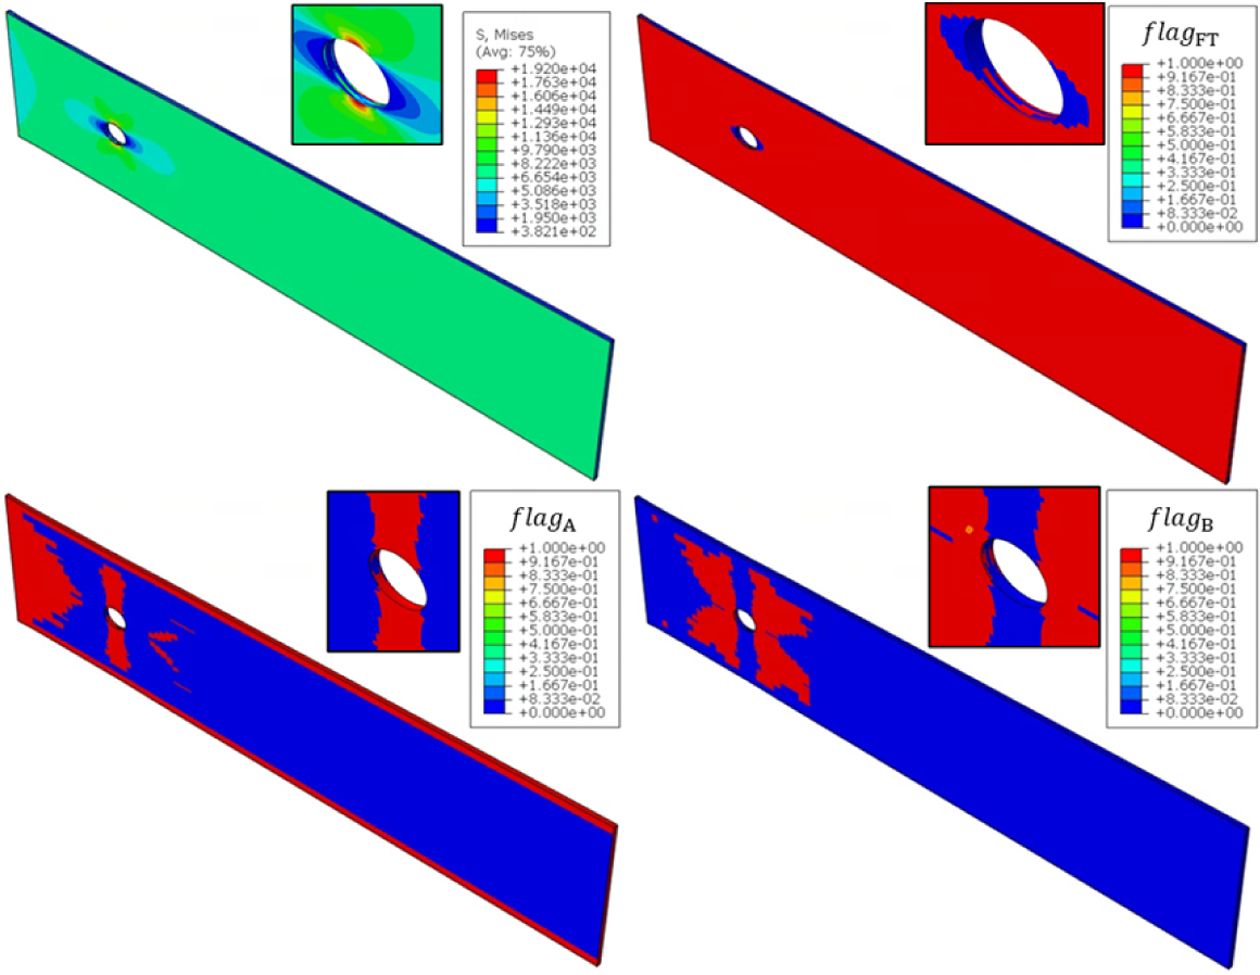
Fig. 11 shows the stress analysis result and corresponding fatigue flag. flagFC, and flagC are locally activated. The results show that the stress is dominant in the top layer that is longitudinally aligned [0]. Therefore, the flagFT is mostly occurred in [0] layer. The flag flagA is activated on top and bottom of the hole since the transversal tension is applied in it during the flag flagB is activated on left and right sides of the hole since the transversal compression is applied in it.
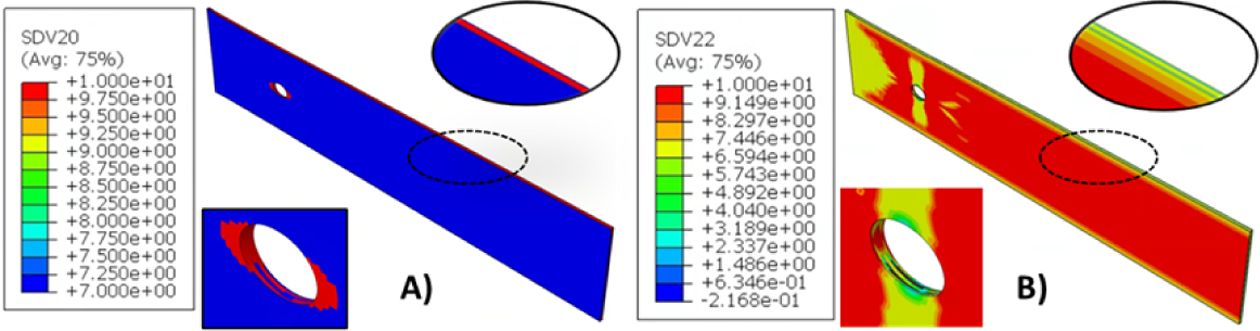
Fig. 12 shows the fatigue life prediction results corresponding to the fatigue flag. Fig. 12A) shows the fatigue life prediction result when flagFT is activated and Fig. 12B) shows the fatigue life prediction result when flagA is activated. This result shows that the stress magnitude is larger in longitudinally aligned layers [0], but the fatigue life is shorter in [90/45/-45] layers. Because the minimum fatigue life in transversally aligned layers [90/45/-45] is 101.486 while minimum fatigue life in longitudinally aligned layers [0] is 107 (default value since calculated fatigue life using fatigue properties is greater than 107).
|
Fig. 7 Schematic view of the laminated composite and FE model without open-hole |
|
Fig. 8 Stress analysis results and corresponding fatigue flag |
|
Fig. 9 Fatigue life prediction corresponds to fatigue flag |
|
Fig. 10 Schematic view of the laminated composite and FE model with open-hole |
|
Fig. 11 Stress/flagFT/flagA/flagB contour of FE model with openhole |
|
Fig. 12 Fatigue life prediction of the composite and FE model with open-hole. A) Fatigue life when flagFT is activated B) Fatigue life when flagA is activated |
This paper proposes a fatigue life prediction methodology that uses multiple S-N curves for the laminated composite with different ply orientations. The proposed model has advantages in quick calculation by utilizing S-N curves and practical usage by implementing it into ABAQUS user material subroutine. The proposed model's algorithmic steps are presented with material properties and experimental S-N curves. By curve fitting, experimental S-N curves obtain the fatigue properties of the various loading conditions. Finally, the fatigue analysis with finite elements is presented for a composite model with and without an open hole. The fatigue life prediction result shows that the fatigue life is shorter on transversally aligned layers even though the stress is dominant in the longitudinal direction.
The Agency of Defense Development (20210211EAD-00) and the Institute of Engineering at Seoul National University supported the research. The authors are grateful for their support.
- 1. Kamal, M., and Rahman, M.M., “Advances in Fatigue Life Modeling: A Review,” Renewable and Sustainable Energy Reviews, Vol. 82, 2018, pp. 940-949.
-

- 2. Cui, W., “A State-of-the-art Review on Fatigue Life Prediction Methods for Metal Structures,” Journal of Marine Science and Technology, Vol. 7, No. 1, 2002, pp. 43-56.
-
- 3. Kim, Y.J., You, H., Kim, S.J., and Yun, G.J., “Effects of Porosity on the Fatigue Life of Polyamide 12 Considering Crack Initiation and Propagation,” Advanced Composite Materials, Vol. 29, No. 4, 2020, pp. 399-421.
-
- 4. Ha, D., Kim, T., Kim, J.H., Joo, Y.S., and Yun, G., “Fatigue Life Prediction of CFRP Laminates with Stress Concentration Lamina Level Failure Criteria,” Advanced Composite Materials, 2022, pp. 1-21.
-
- 5. Naderi, M., Michopoulos, J., Iyyer, N., Goel, K., and Phan, N., “Multiscale Analysis of Fatigue Crack Initiation Life for Unidirectional Composite Laminates,” Composite Structures, Vol. 213, 2019, pp. 271-283.
-
- 6. Reifsnider, K.L., and Gao, Z., “A Micromechanics Model for Composites under Fatigue Loading,” International Journal of Fatigue, Vol. 13, No. 2, 1991, pp. 149-156.
-
- 7. May, M., and Hallett, S.R., “An Advanced Model For Initiation and Propagation of Damage under Fatigue Loading–part I: Model Formulation,” Composite Structures, Vol. 93, No. 9, 2011, pp. 2340-2349.
-
- 8. Quaresimin, M., and Carraro, P., “Damage Initiation and Evolution In Glass/epoxy Tubes Subjected to Combined Tension–torsion Fatigue Loading,” International Journal of Fatigue, Vol. 63, 2014, pp. 25-35.
-
- 9. Harper, P.W., and Hallett, S.R., “A Fatigue Degradation Law for Cohesive Interface Elements–development and Application to Composite Materials,” International Journal of Fatigue, Vol. 32, No. 11, 2010, pp. 1774-1787.
-
- 10. Erden, S., Sever, K., Seki, Y., and Sarikanat, M., “Enhancement of the Mechanical Properties of Glass/polyester Composites via Matrix Modification Glass/polyester Composite Siloxane Matrix Modification,” Fibers and Polymers, Vol. 11, No. 5, 2010, pp. 732-737.
-
- 11. Stelzer, S., Brunner, A.J., Argüelles, A., Murphy, N., and Pinter, G., “Mode I Delamination Fatigue Crack Growth in Unidirectional Fiber Reinforced Composites: Development of a Standardized Test Procedure,” Composites Science and Technology, Vol. 72, No. 10, 2012, pp. 1102-1107.
-
- 12. Gregory, J.R., and Spearing, S.M., “A Fiber Bridging Model for Fatigue Delamination in Composite Materials,” Acta Materialia, Vol. 52, No. 19, 2004, pp. 5493-5502.
-
- 13. Bak, B.L.V., Sarrado, C., Turon, A., and Costa, J., “Delamination Under Fatigue Loads in Composite Laminates: A Review on the Observed Phenomenology and Computational Methods,” Applied Mechanics Reviews, Vol. 66, No. 6, 2014, pp. 060803.
-
- 14. Fazlali, B., Lomov, S.V., and Swolfs, Y., “Fiber Break Model for Tension-tension Fatigue of Unidirectional Composites,” Composites Part B: Engineering, Vol. 220, 2021, pp. 108970.
-
- 15. Wang, X., and Chung, D., “Fiber Breakage in Polymer-matrix Composite during Static and Fatigue Loading, Observed by Electrical Resistance Measurement,” Journal of Materials Research, Vol. 14, No. 11, 1999, pp. 4224-4229.
-
- 16. Gamstedt, K., “Fatigue Damage Mechanisms in Polymer Matrix Composites,” Luleå Tekniska Universitet, 1997.
- 17. Pakdel, H., and Mohammadi, B., “Stiffness Degradation of Composite Laminates due to Matrix Cracking and Induced Delamination during Tension-tension Fatigue,” Engineering Fracture Mechanics, Vol. 216, 2019, pp. 106489.
-
- 18. Samareh-Mousavi, S.S., and Taheri-Behrooz, F., “A Novel Creep-fatigue Stiffness Degradation Model for Composite Materials,” Composite Structures, Vol. 237, 2020, pp. 111955.
-
- 19. Van Paepegem, W., and Degrieck, J., “Fatigue Degradation Modelling of Plain Woven Glass/epoxy Composites,” Composites Part A: Applied Science and Manufacturing, Vol. 32, No. 10, 2001, pp. 1433-1441.
-
- 20. Dutra, T.A., Ferreira, R.T.L., Resende, H.B., Blinzler, B.J., and Larsson, R., “Expanding Puck and Schürmann inter Fiber Fracture Criterion for Fiber Reinforced Thermoplastic 3D-printed Composite Materials,” Materials, Vol. 13, No. 7, 2020, pp. 1653.
-
- 21. Kennedy, C.R., Brádaigh, C.M.Ó., and Leen, S.B., “A Multiaxial Fatigue Damage Model for Fibre Reinforced Polymer Composites,” Composite Structures, Vol. 106, 2013, pp. 201-210.
-
 This Article
-
2023; 36(1): 42-47
Published on Feb 28, 2023
- 10.7234/composres.2023.36.1.042
- Received on Dec 14, 2022
- Revised on Feb 13, 2023
- Accepted on Feb 14, 2023
Services
- Abstract
1. introduction
2. fatigue life prediction methodology using multiple s-n curves
3. fatigue analysis with fe simulation
4. conclusions
- Acknowledgements
- References
- Full Text PDF
Shared
Correspondence to
- Gun Jin Yun
-
Department of Aerospace Engineering, Seoul National University, Seoul 08826, Korea
- E-mail: gunjin.yun@snu.ac.kr
Gangnam Mirae Tower, Suite 601, 174 Saimdang-ro, Seocho-gu, Seoul 06627, South Korea
Tel: +82-2-598-1550 Fax: +82-2-598-1557 E-mail: composites@kscm.re.kr